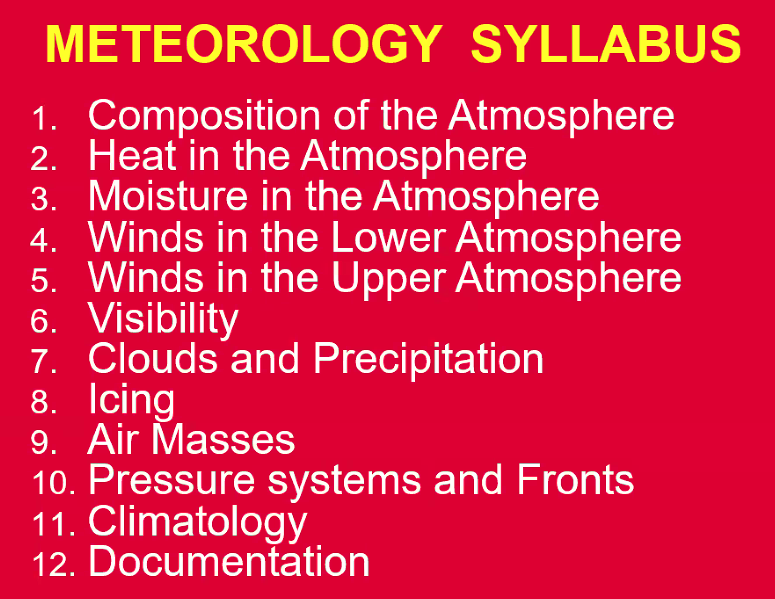
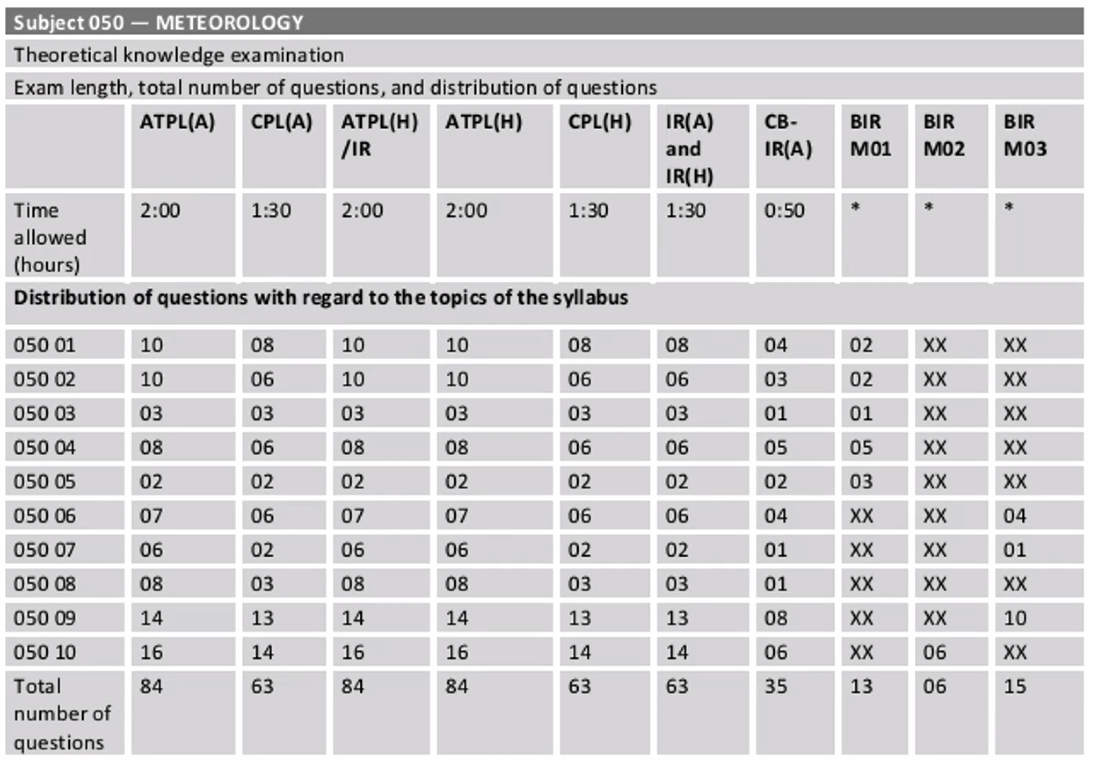
Meteorology
Exam Information
- Atmosphere: 10 Questions
- Wind: 10 Questions
- Thermodynamics: 3 Questions
- Clouds and Fog: 8 Questions
- Precipitation: 2 Questions
- Air Masses and Fronts: 7 Questions
- Pressure Systems: 6 Questions
- Climatology: 8 Questions
- Flight Hazards: 14 Questions
- Met Information: 16 Questions
- Total: 84 Questions | Duration: 2 hours
- Instructor: JJ
The Atmosphere: Composition, Heat, Moisture and Lapse Rates
Atmospheric Composition
The atmosphere consists of:
- ==78% Nitrogen==
- ==21% Oxygen==
- ==1% CO₂, Rare gases (mostly Argon), Moisture, Solid Particles==
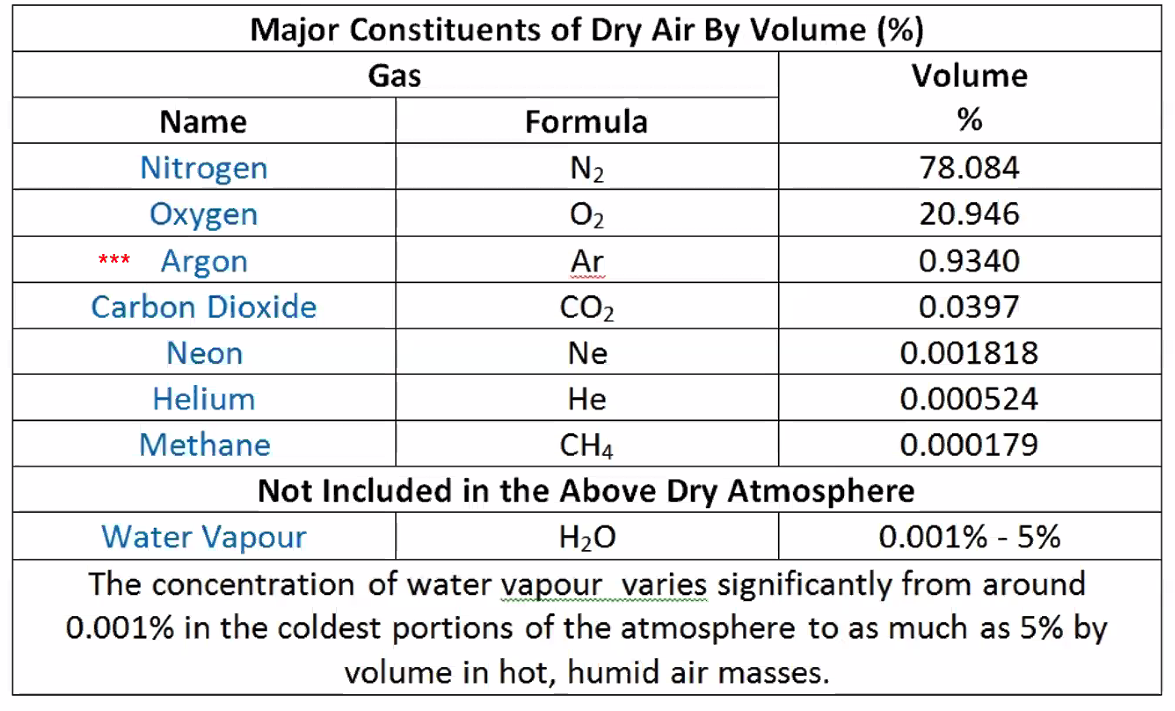
NOTE
Interesting how the majority of the 1% is Argon (also an exam question)
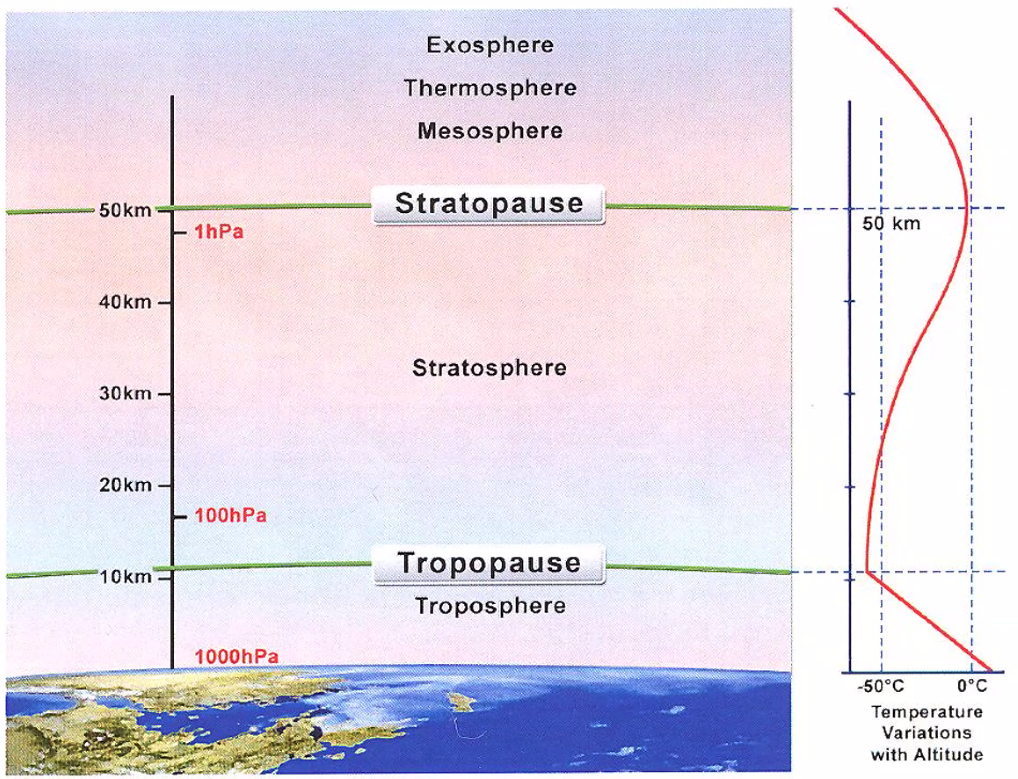
Atmospheric Layers
Troposphere
Characteristics:
- Begins at surface
- Depth varies from equator to poles:
- ==At equator: 16 km deep==
- ==At 50°N/S: 9-12 km depending on season==
- ==At poles: 8 km==
- Temperature decreases with height
- ==Contains three-quarters of all the gases==
- ==Contains 90% of the water==
IMPORTANT
==Under ISA Conditions:==
- ==Pressure is approx 50% of MSL pressure at 18,000 ft==
- ==Density is approx 50% of MSL density at 22,000 ft==
- ==Density is 25% of MSL at 40,000 ft==
Tropopause
The boundary between the troposphere and the stratosphere, where an abrupt change in lapse rate usually occurs.
Definition: ==The lowest level at which the lapse rate decreases to 2°C/km or less, provided that the lapse rate between this level and all higher levels within 2 km does not exceed 2°C/km (0.6°C/1000 ft).==
Characteristics:
- Height where temperature decrease with altitude ceases
- ==Stable air - vertical movement inhibited==
- Height affected by surface temperature variations due to latitude, season and type of surface
- ==Large surface temperature change over short distance causes tropopause breaks (or folds)==
- ==Coincident with air mass boundaries==
Breaks or folds in the tropopause reflect the positions of the polar and sub-tropical fronts
Stratosphere
Extent: ==Tropopause to 50 km AMSL==
Characteristics:
- Lower layers isothermal
- ==20 km upwards - temperature increases (O-zone layer)==
- Ozone Cycle absorbs harmful (shortwave) UV and releases longer wave which warms this part of the atmosphere
- ==Very stable - generally no convection so no convective cloud or associated turbulence==
- Local temporary convection possible - convective overshoot, volcanic activity
- Turbulence from variations in the jet stream and standing waves can penetrate into the stratosphere
- ==Nacreous Cloud (Polar Stratospheric Clouds) - lower stratosphere in polar winter (15-25 km, where temp is -78°C)==
Q. Which of the following are advantages of choosing a cruising level in the lower stratosphere? A. Economic fuel consumption, Better TAS, Very few clouds, Less turbulence
Stratopause
- ==Boundary between the stratosphere and the mesosphere==
- ==On Earth, the stratopause is approx 50 km above the Earth’s surface==
- ==The atmospheric pressure is around 1/1000 of the pressure at sea level==
Mesosphere
Extent: ==Stratopause to 85 km==
Characteristics:
- Temperature decreases with height
- ==Coldest temperatures in Earth’s atmosphere, about -90°C are found near the top of this layer==
- Can get clouds called noctilucent clouds at about 80 km
- High latitudes in summer
Thermosphere
Extent: ==Mesopause to 600 km==
Characteristics:
- Includes the ionosphere which HF radio waves bounce off
- Aurora borealis
- ==Temperature increases with height from around -90°C to 2000°C==
- Incoming high energy ultraviolet and X-ray radiation absorbed by the molecules in this layer causes the large temperature increase
- Total number of molecules not enough to burn skin
Exosphere
- ==The outermost layer of the atmosphere==
- ==Extends from the top of the thermosphere to 10,000 km above the earth==
Density
IMPORTANT
==Density is:==
- ==Proportional to pressure==
- ==Inversely proportional to temperature==
Moisture and Density
WARNING
==Moist air is LESS dense than dry air at the same temperature and pressure==
- ==Dry air: 1,225 g/m³==
- ==Water vapour: 760 g/m³==
- ==More humid = Less dense==
Vertical Spacing
IMPORTANT
==Need to use 30 ft per mb and 9 m per mb in the exam==
Formula (not required for exam): Feet per mb/hPa at any level = 96 × (temp in K / Pressure)
International Standard Atmosphere (ISA)
ISA at Mean Sea Level
==MSL Conditions:==
- ==Temperature: 15°C==
- ==Pressure: 1013.25 hPa==
- ==Density: 1,225 g/m³==
ISA Lapse Rates
==Lapse Rate: 1.98°C/1000 ft = 6.5°C/1000 m==
- Until 36,090 ft / 11 km
- Then -56.5°C until 65,617 ft / 20 km
- Then warms up by 0.3°C/1000 ft
- To 104,987 ft / 32 km
ISA Temperature Calculations
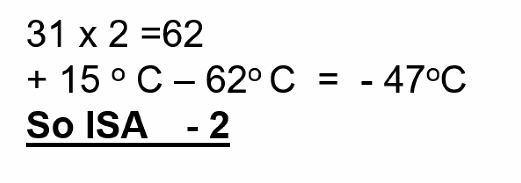
Q. Aircraft at FL210, Ambient Temperature -49°C, what is the temperature deviation from ISA? A. ISA -2
Q. Aircraft at FL215, Ambient Temperature -24°C, Temp deviation from ISA? A. ISA +4
Q. ISA deviation is -7°C, what is the OAT at FL190? A. -30°C
Q. OAT at FL390 is -58°C, what is the ISA deviation? A. ISA -1.5°C
In the ISA the tropopause is at 36,000 ft. Above this the temp is a constant -56.5°C, so it is ISA -1.5
Altimeter Sub-scale Datums
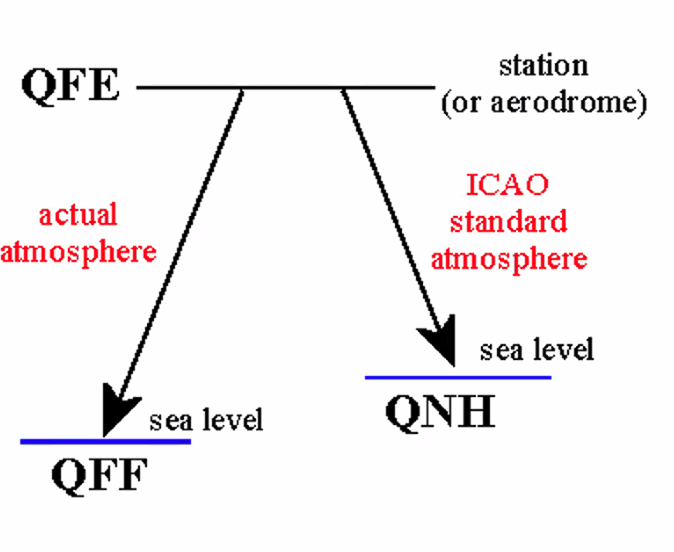
QFE: ==Pressure observed at the airfield datum==
QNH: ==QFE adjusted to mean sea level using ISA lapse rate==
QFF: ==QFE adjusted to MSL using environmental lapse rate==
QNE: ==Height indicated on landing with standard pressure set (1013.25)==
Altimeter Reading Rules
CAUTION
==Below ISA: True Alt < Indicated Altimeter OVER-READS==
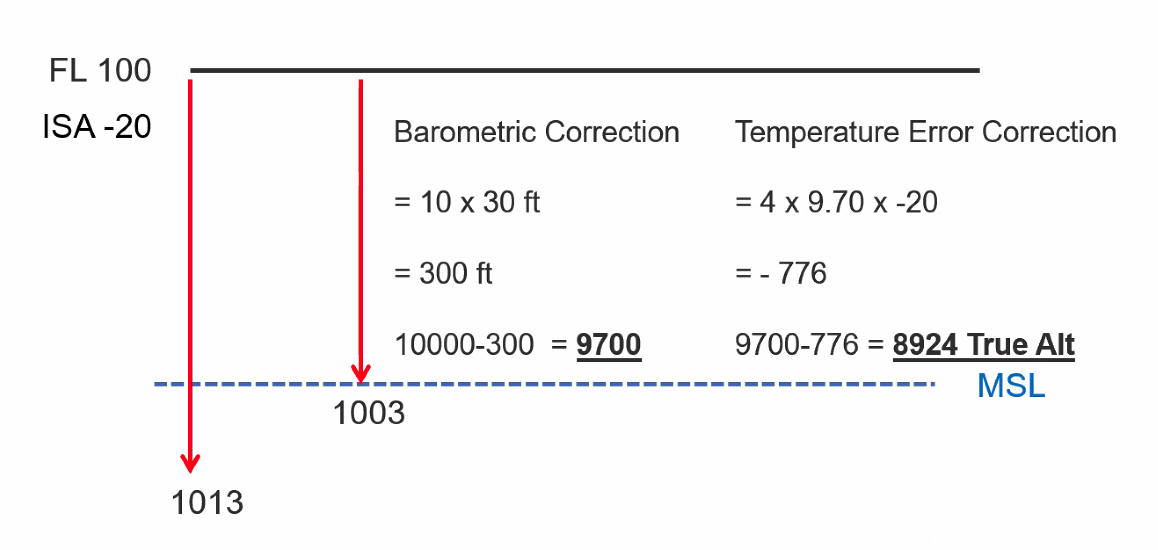
Q. An aircraft is flying at FL100. The local QNH is 1003, and the temperature is ISA -20. What is the true altitude of the aircraft? A. 8,924 ft
Solution:
- Pressure Alt: 10,000 ft
- Indicated Alt: 10,000 ft - (10 × 30) = 9,700 ft
- True Alt: 4 × (9,700 / 1,000) × -20 = -776
- 9,700 - 776 = 8,924 ft
QNH/QFF Relationships
==For aerodromes at sea level: QFE = QNH = QFF==
Airfield above MSL:
- ==If warmer than ISA: QNH > QFF==
- ==If colder than ISA: QNH < QFF==
Airfield below MSL:
- ==Warmer than ISA: QNH > QFF==
- ==Colder than ISA: QNH > QFF==
Q. You must make an emergency landing at sea. The QNH of a field on a nearby island with an elevation of 4,000 ft is 1025 hPa and the temp is -20°C. What is your pressure altimeter reading when landing if 1025 hPa is set in the subscale? A. Less than 0 ft
Heat in the Atmosphere
Insolation
==Insolation: Exposure to the sun’s rays==
Factors affecting insolation:
- Latitude
- Time of day
- Time of year
- Losses in the atmosphere
- Type of surface
- Topography
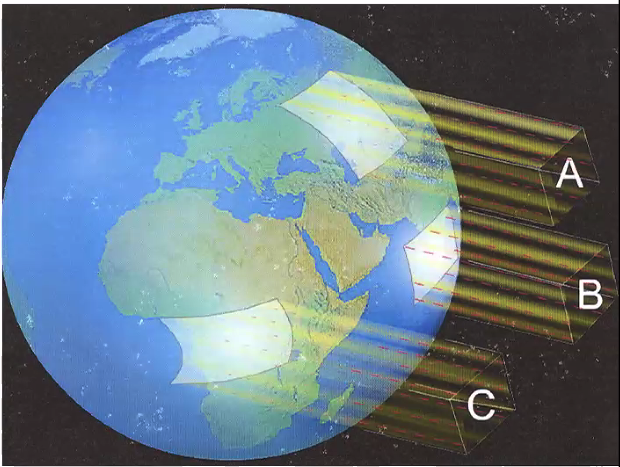
Radiation arrives in parallel lines from the sun. Same intensity at A, B and C, but A and C have to cover much more area than that of B.
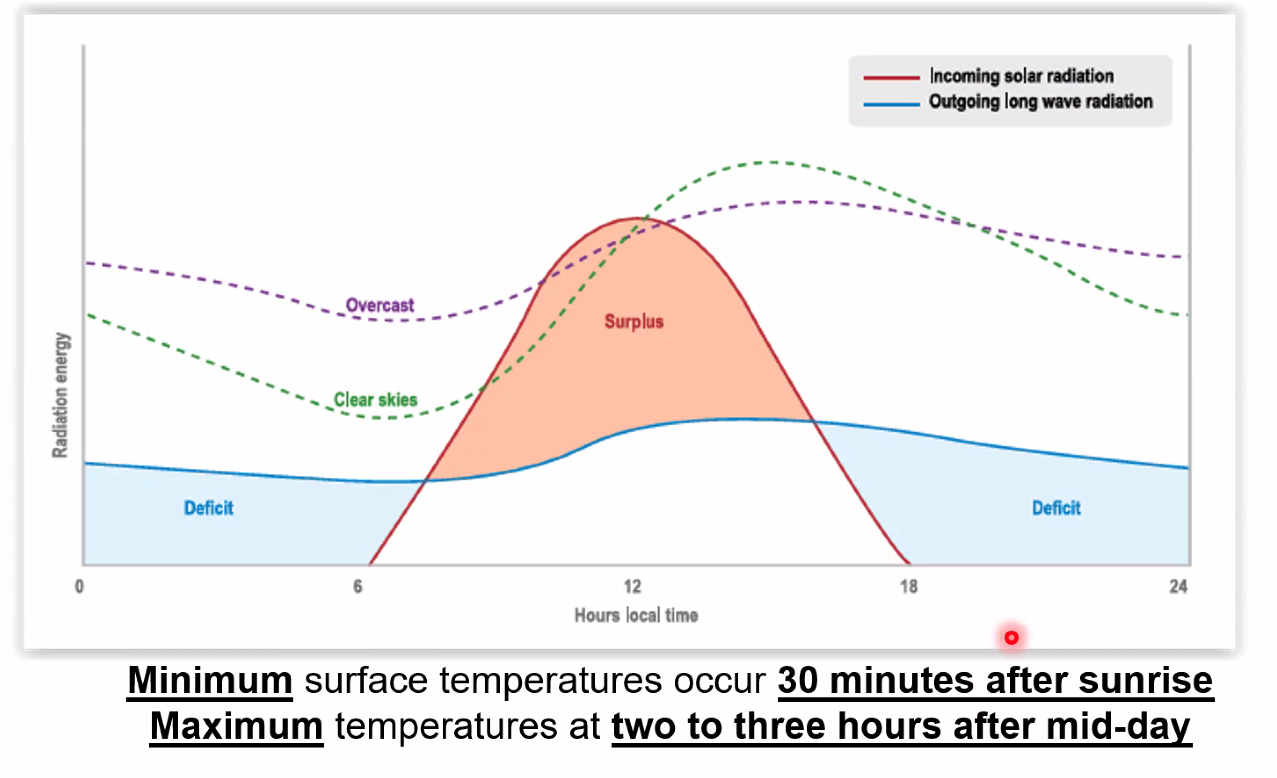
Diurnal Variation: Difference in temperature based on time of day
Terrestrial Radiation: The radiation emitted by the planet
Methods of Atmospheric Heating
1. Conduction
- ==Transfer of heat by direct physical contact (hand on radiator)==
- Surface of the earth only heat source - bottom few thousand feet only as air is a poor conductor
2. Radiation
- ==Short wave solar radiation IN, Longwave terrestrial radiation OUT==
- Longwave absorbed readily by atmospheric gases
3. Convection
- ==Vertical movement of air due to density==
- Hot air is less dense and rises, colder air denser and sinks
- Large amounts of heat energy transferred this way
4. Advection
- ==Transfer of heat energy by horizontal movement of the air (wind)==
- Doesn’t heat the troposphere - redistributes the energy within it
- ==Warm Air Advection is common behind warm fronts and ahead of cold fronts==
- ==Cold Air Advection is common behind cold fronts==
5. Turbulence
- Mechanical movement of air transfers heat from top to bottom and bottom to top of friction layer
- ==Through this turbulent mixing the friction layer close to the surface adopts a DALR temperature gradient==
- At the upper level of the friction layer an inversion can occur
Moisture in the Atmosphere
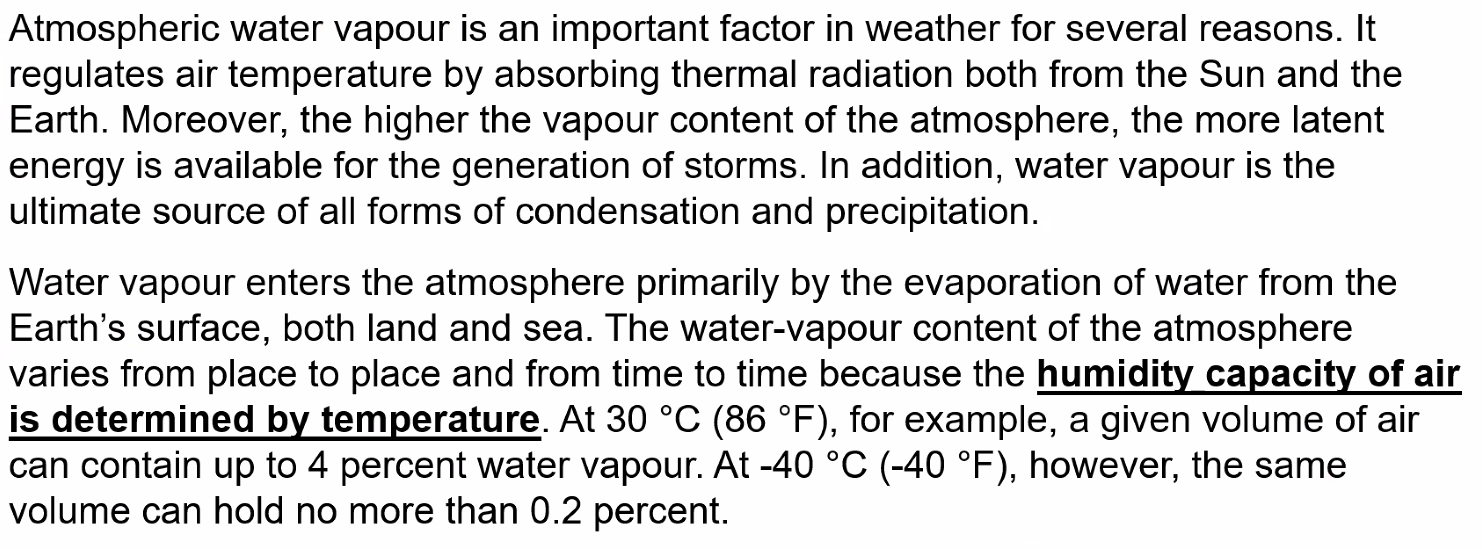
Key Definitions
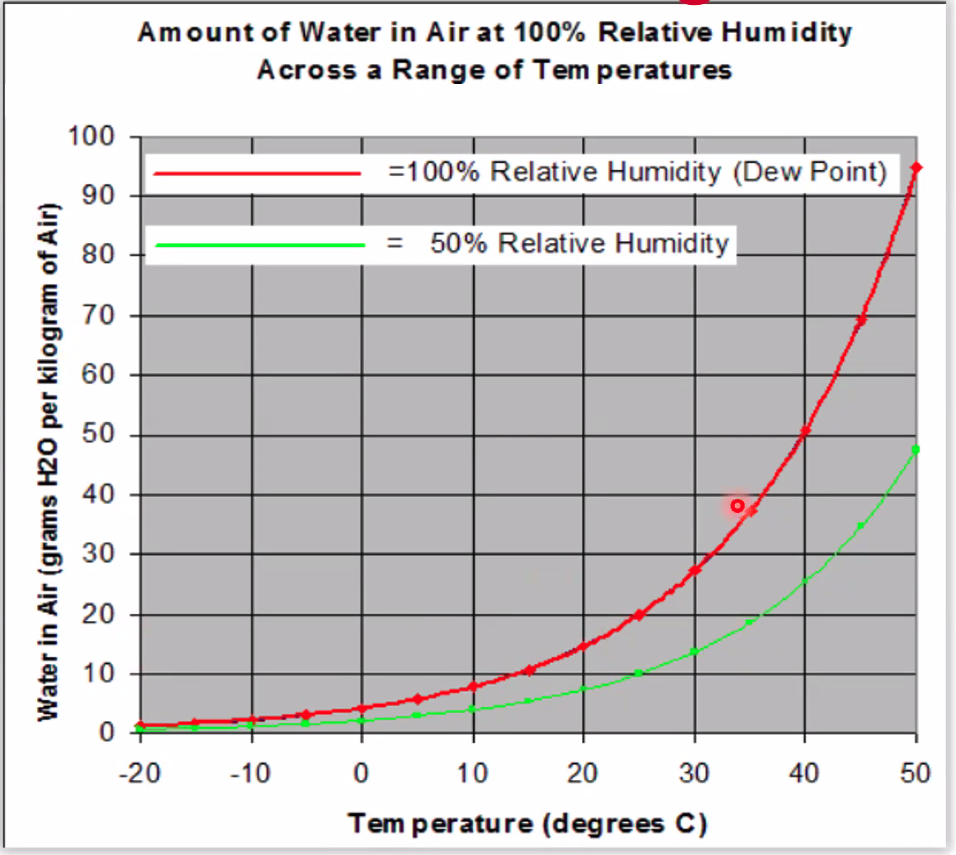
Relative Humidity: The ratio of the amount of water vapour present in the air to the maximum it could hold at its present temperature (expressed as a %)
Dew Point: The temperature to which a sample of air must be cooled for it to become saturated. Any further cooling will cause condensation of surplus moisture
Mixing Ratio: The ratio in grams or kg of water vapour to dry air. The saturation mixing ratio is the value at which a sample of air becomes saturated
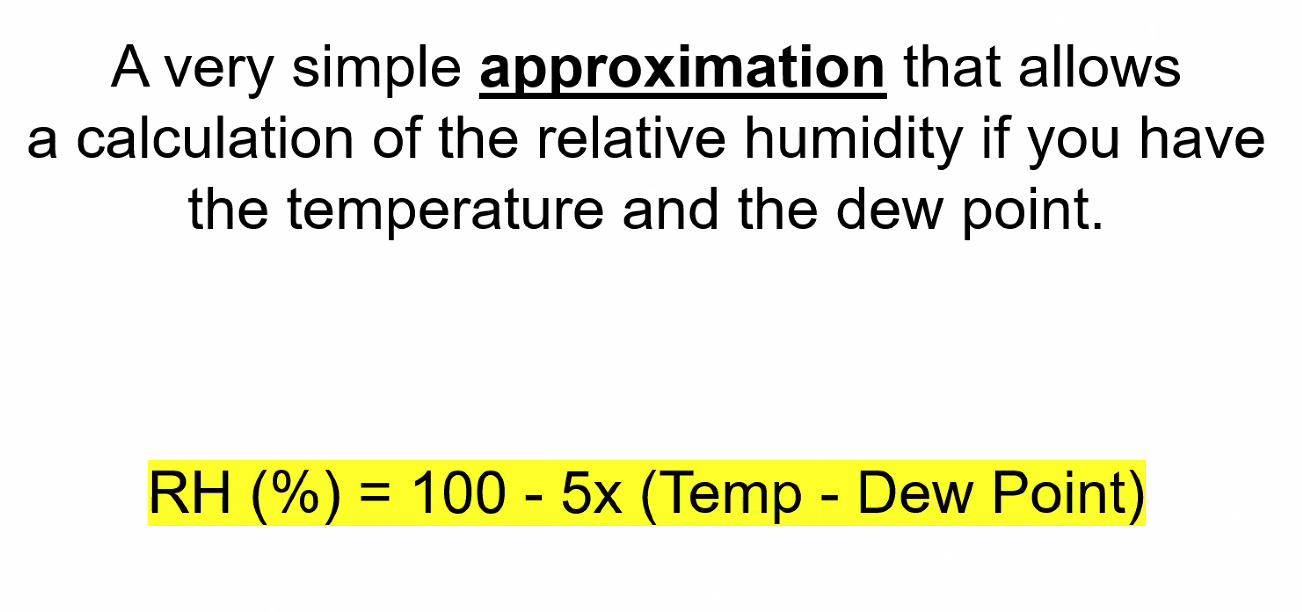
Relative Humidity Calculation
Q. If the OAT is 30°C and the Dew Point is 21°C, then the relative humidity would be approximately: A. 55%
100 - 5 × 9 = 100 - 45 = 55%
Temperature Measurements
Dry Bulb Temperature: The OAT
Wet Bulb Temperature: The lowest temperature to which the ambient air (flowing around a moistened thermometer bulb) can be cooled by the evaporation of water. The greater the humidity the lesser the evaporation
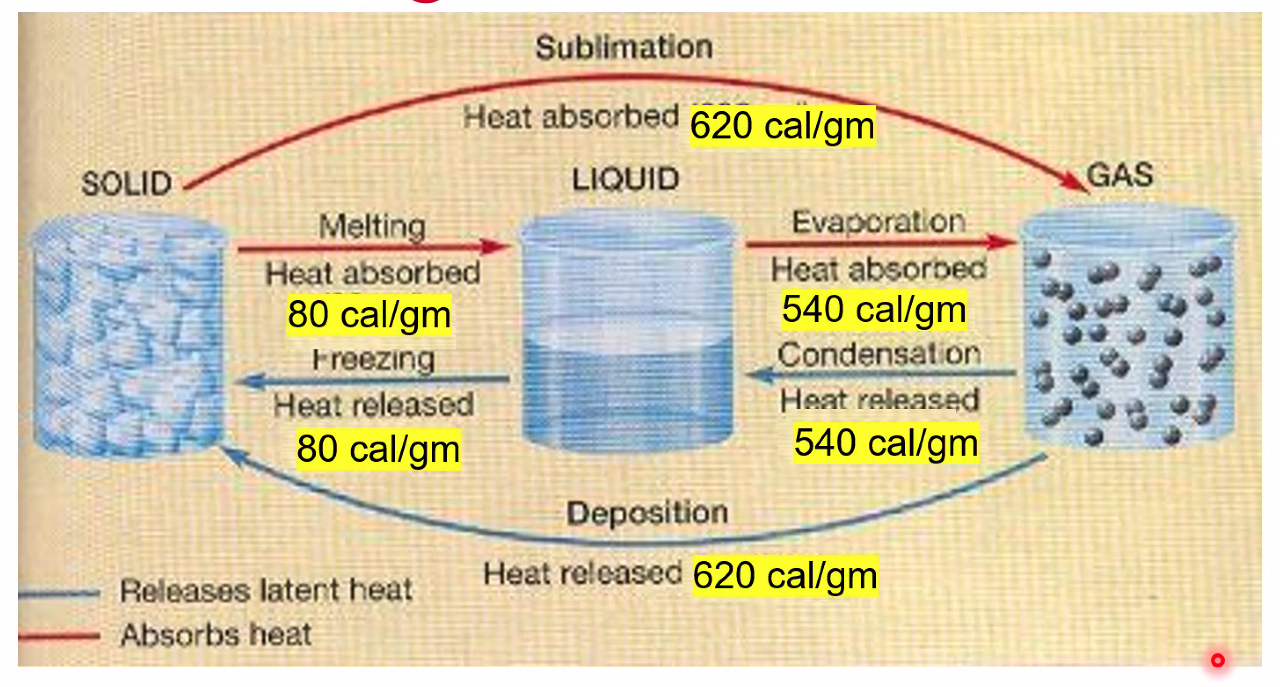
Latent Heat: Release of energy during phase changes
Adiabatic Expansion and Compression
Basic Principles
==As something expands, it cools down As something compresses, it heats up==
Convection takes place rapidly, in minutes, and the rising air does not mix with the environment (usually). It behaves rather as though it were inside a balloon, and this isolation means that no energy will pass into or out of the rising parcel of air. The scientific word for this is that the process is adiabatic.
NOTE
Strictly speaking, adiabatic processes do not exist, since absolute thermal isolation is not possible. In this sense the adiabatic process is an idealization.
Adiabatic Process
- Rising air experiences a drop in temperature, the decrease in temperature is due to the decrease in pressure at higher altitudes
- If the pressure of the surrounding air is reduced the air parcel will expand
- Total amount of energy remains the same as none is added or lost
- If the air is compressed air volume decreases and it will heat up
- If the air parcel is forced to descend then it will heat up without taking heat from outside
==Once you get to 100% humidity, the DALR will become a SALR==
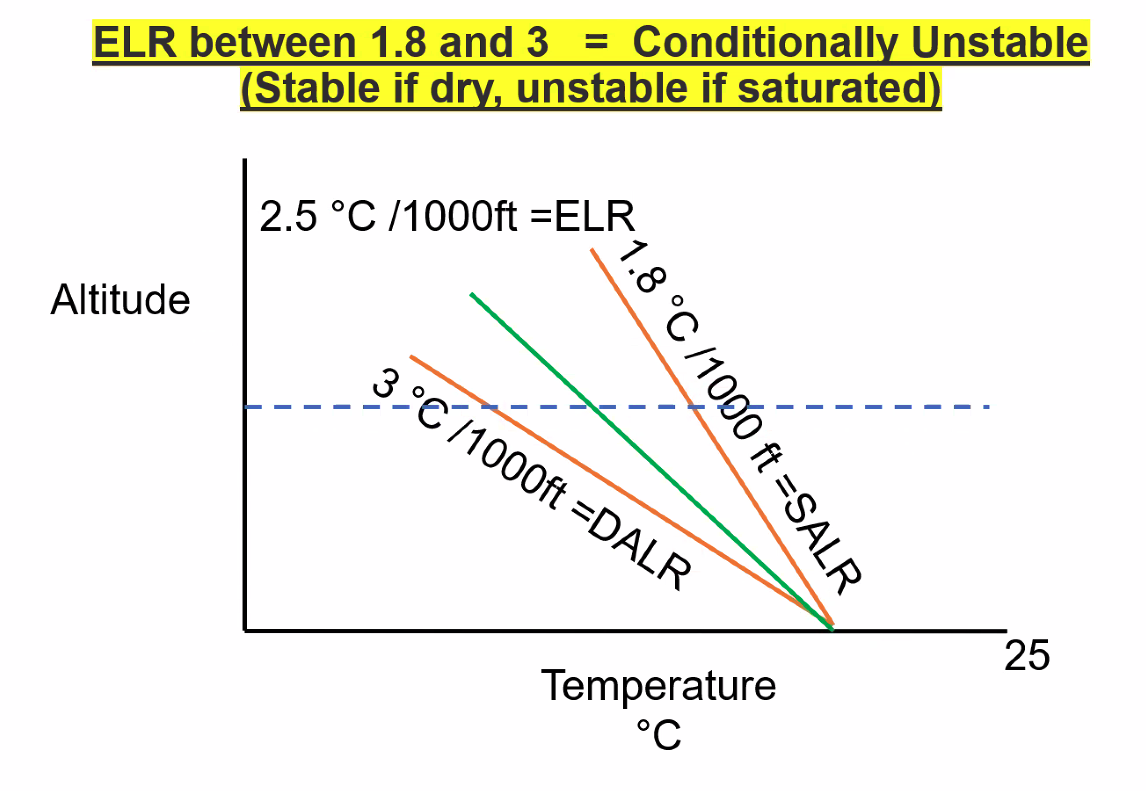
Atmospheric Stability
IMPORTANT
==To decide whether something is absolutely stable or unstable, you’ve got to compare these fixed rates with the environmental lapse rates (which can change)==
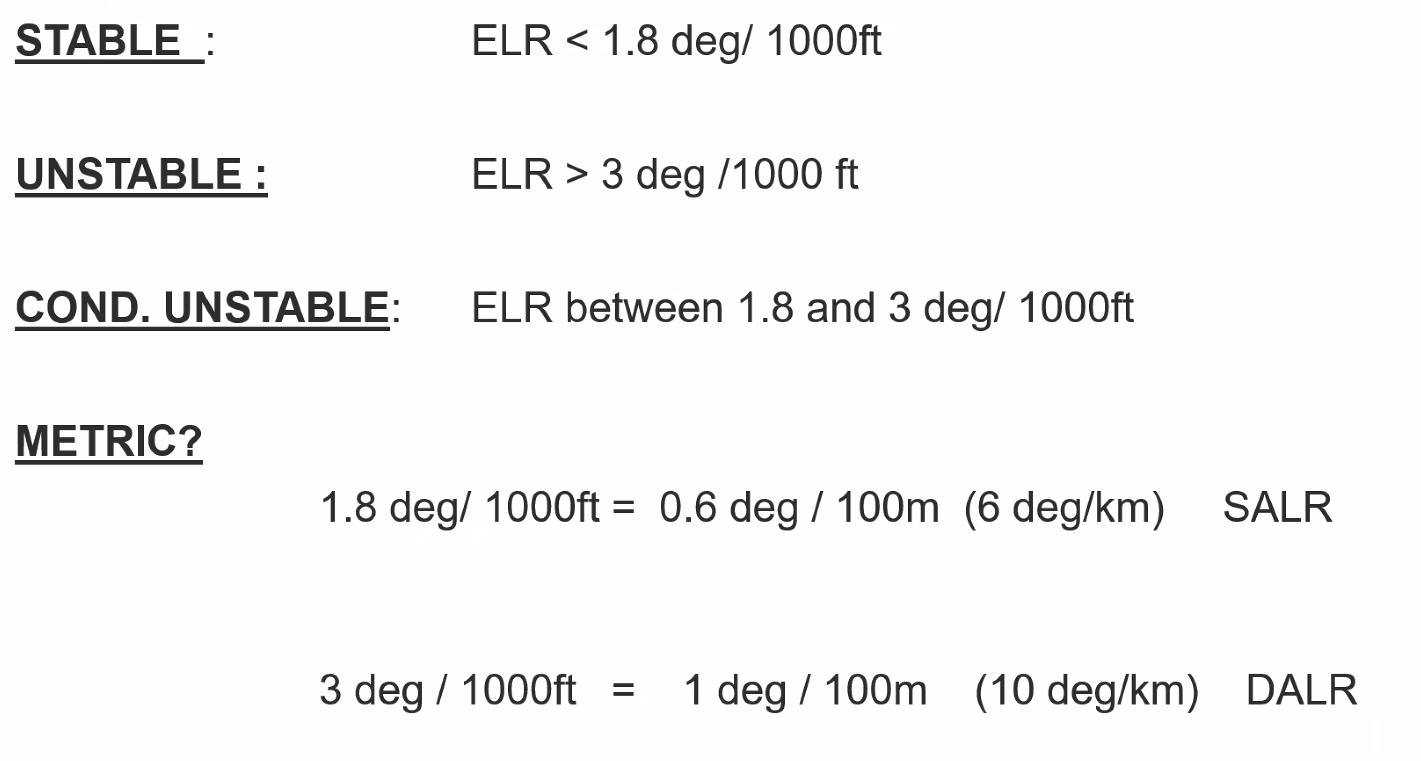
Stability Classifications
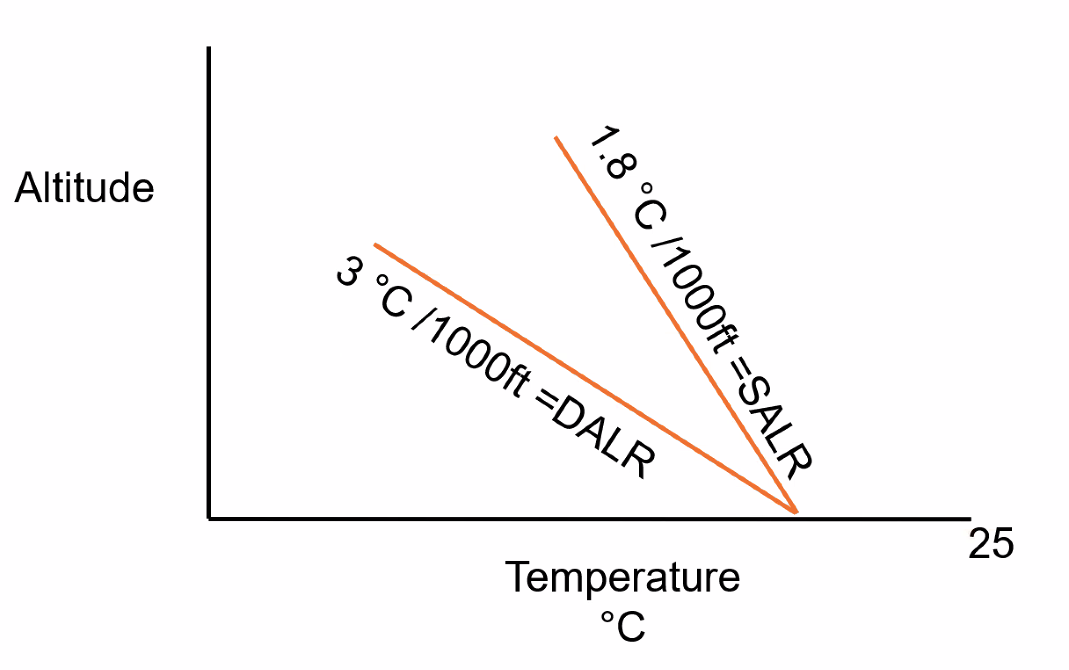
==Environmental lapse rate < 1.8°C/1000 ft = Absolutely Stable==
==Environmental lapse rate > 3°C/1000 ft = Absolutely Unstable==
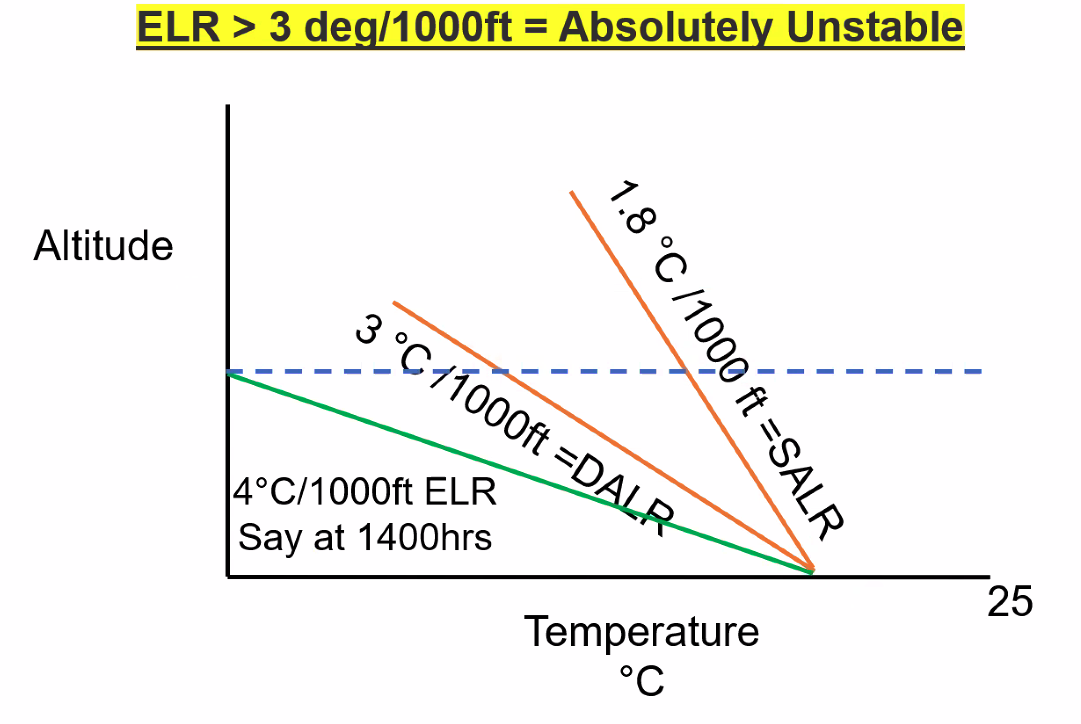
==If the environmental lapse rate is between the DALR and the SALR then it can be said to be Conditionally Unstable==
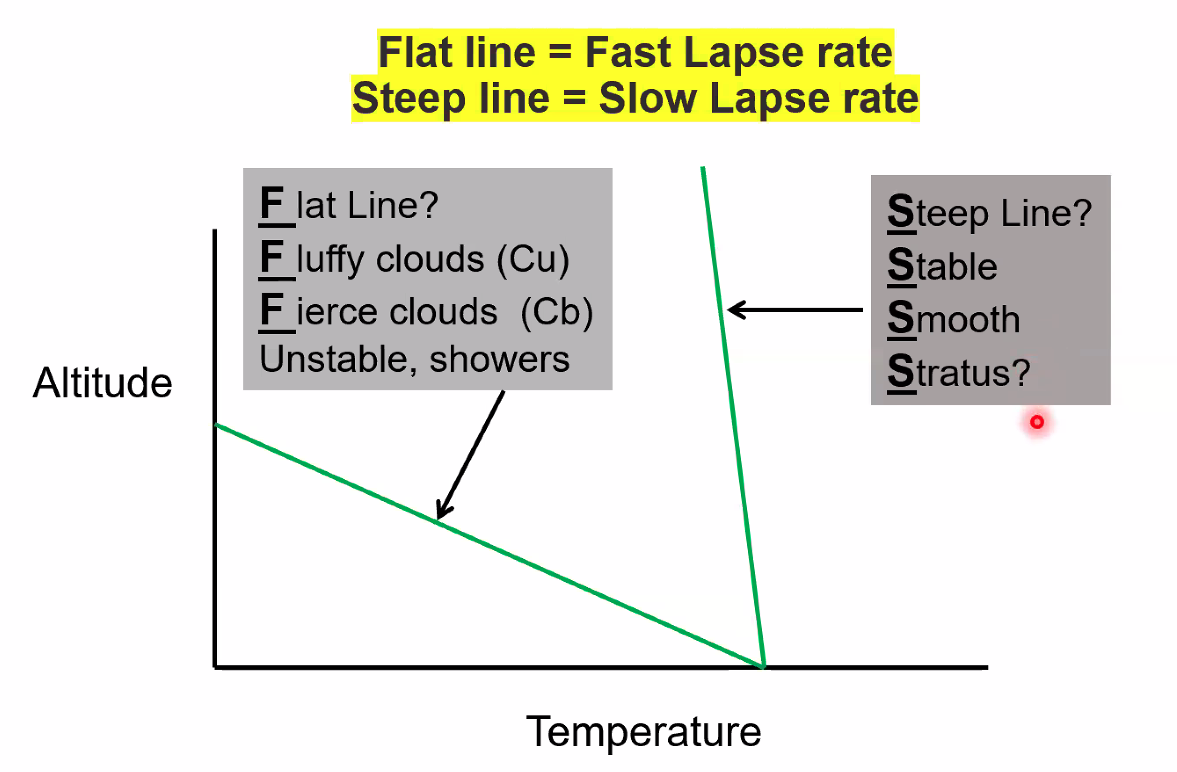
Memory Aid:
- ==Steep Line = Stable = Smooth/Stable==
- ==Flat Line = Unstable = Fluffy Clouds==
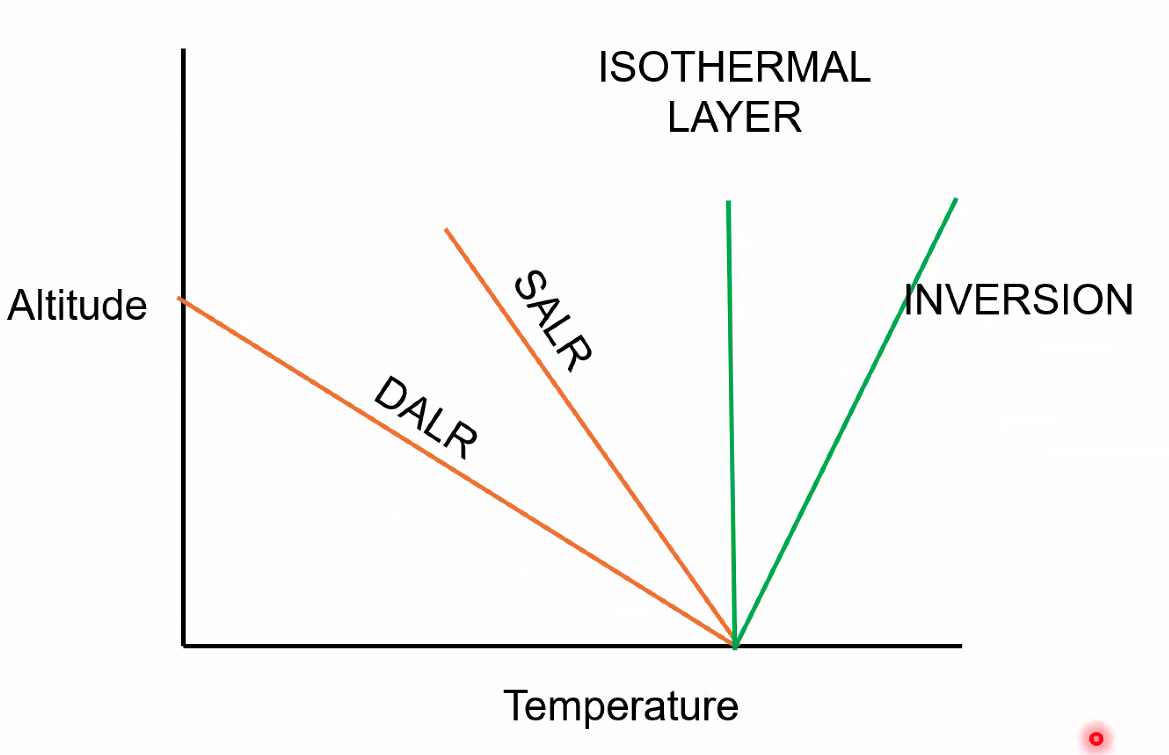
Inversions
Four Ways Inversions Form
- ==At fronts when the warm air comes across==
- ==Surface cooling / adiabatic compression==
- ==Turbulence==
- ==Subsidence==
Flying Through Inversions
- ==Flying down into an inversion: More lift, less engine performance==
- ==Flying up out of an inversion: Less lift, more engine performance, possible windshear==
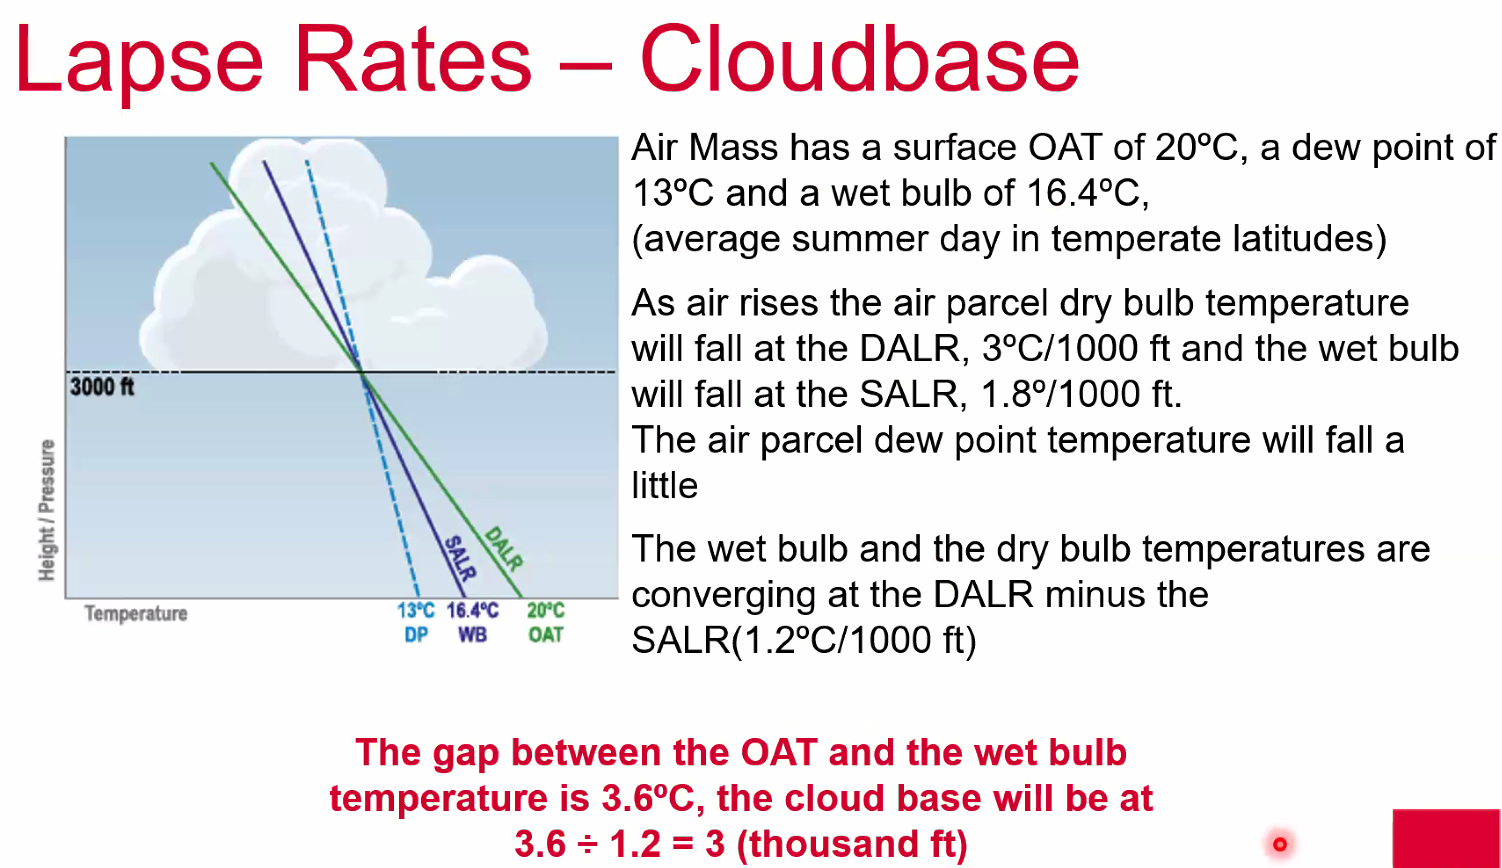
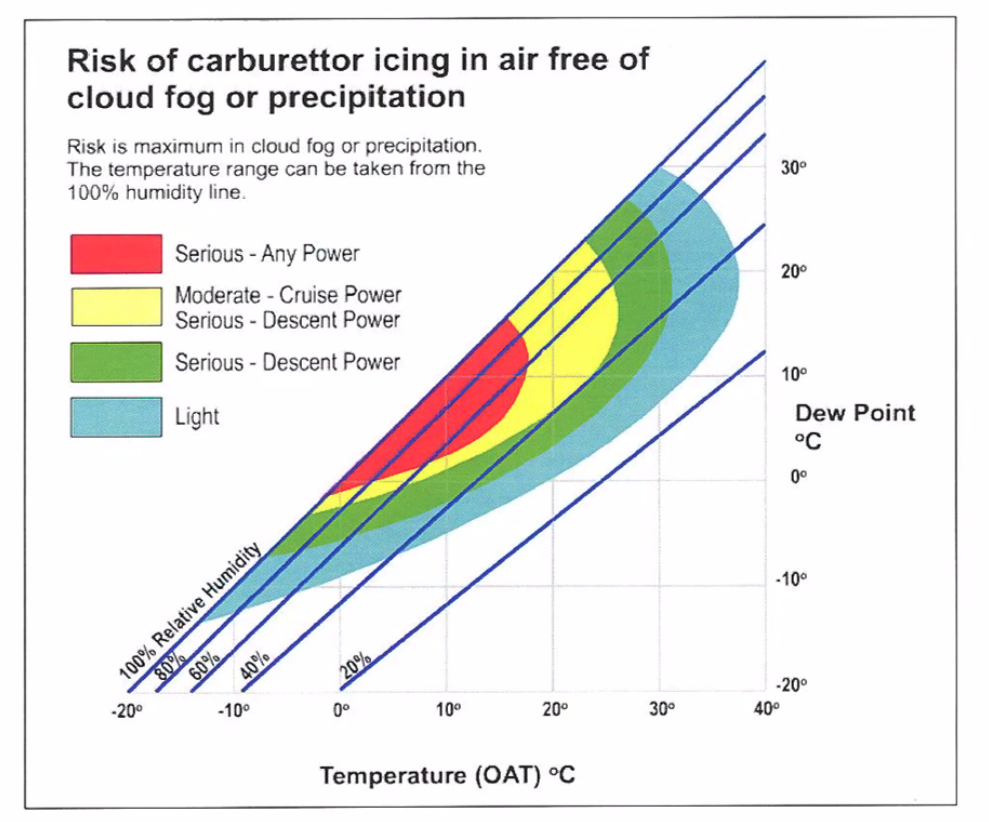
Cloud Base Calculation
IMPORTANT
==OAT (temp) - Dew Point (temp) = Spread==
==Spread × 400 = Cloud Base==
Example:
- OAT of 20°C - DP of 13°C = 7°C
- 7°C × 400 = 2,800 ft Cloud Base
Wind
Wind in the Lower Atmosphere
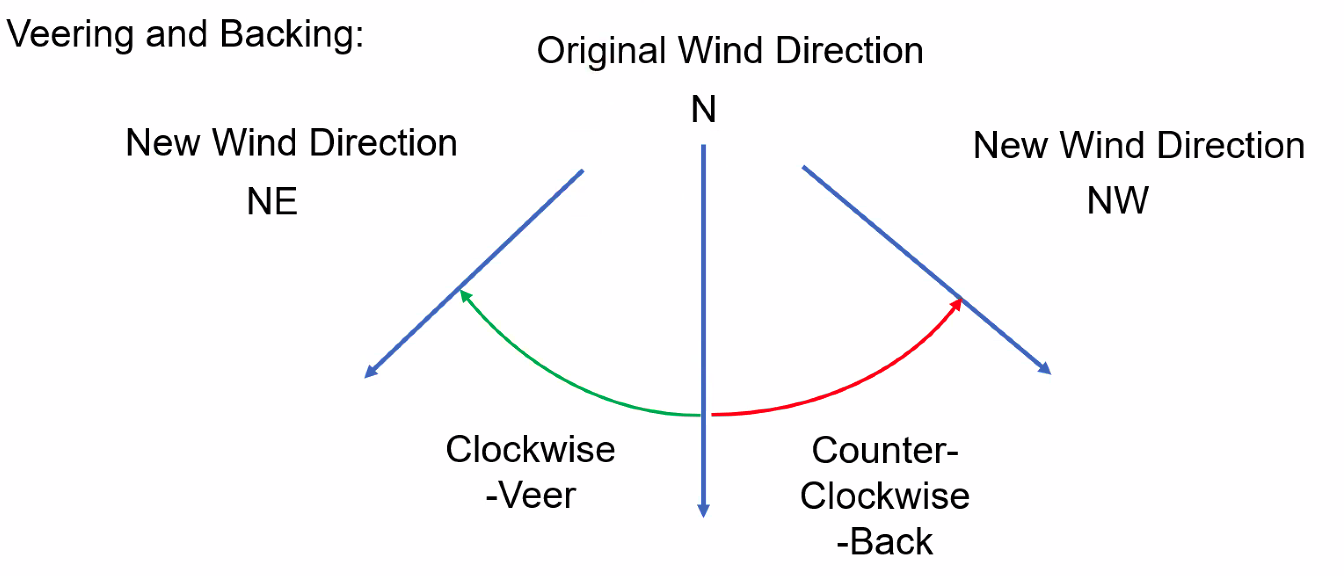
Wind Direction: ==Direction from which it is coming==
- ==True in met reports and forecasts==
- ==Magnetic from ATC or ATIS (as runway direction is relative to magnetic north)==
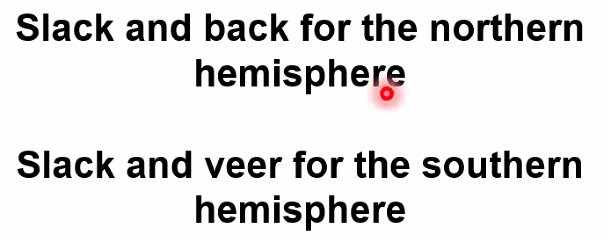
Veering and Backing
Wind Speed: ==Usually in knots, sometimes in metres per second==
- ==MPS × 2 ≈ KTS (1 MPS = 1.94 KTS)==
Wind Velocity: Direction and speed together
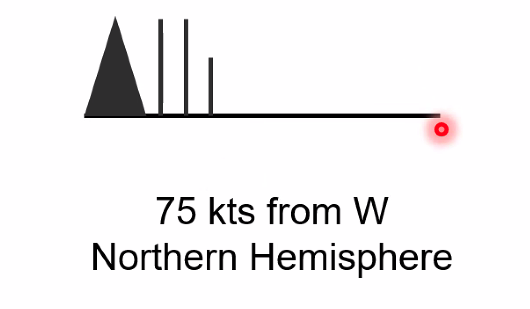
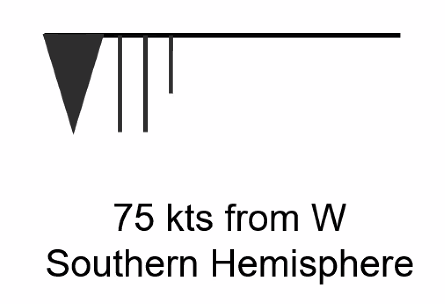
Wind Barbs
NOTE
==Speed symbols on Low Pressure Side==
Gusts and Squalls
Gust
==A brief increase in the speed of the wind (often with a change in direction), usually lasting less than 20 seconds==
Characteristics:
- Gust is followed by a lull or slackening in the wind speed
- ==Winds are least gusty over large water surfaces==
- ==Winds are most gusty over rough land and near high buildings==
- ==In a METAR, if during the 10 min preceding the observation, the maximum gust speed has exceeded the mean speed by 10 KT or more, this gust will be reported by the letter G==
- ==Average period for measuring variations from the mean wind speed (gusts) should be 3 seconds==
Squall
==Sudden, sharp increase in wind speed (often with a change in direction) lasting minutes, as opposed to a wind gust which lasts seconds==
- Usually associated with active weather such as rain showers, thunderstorms or heavy snow
Forces Acting on Air
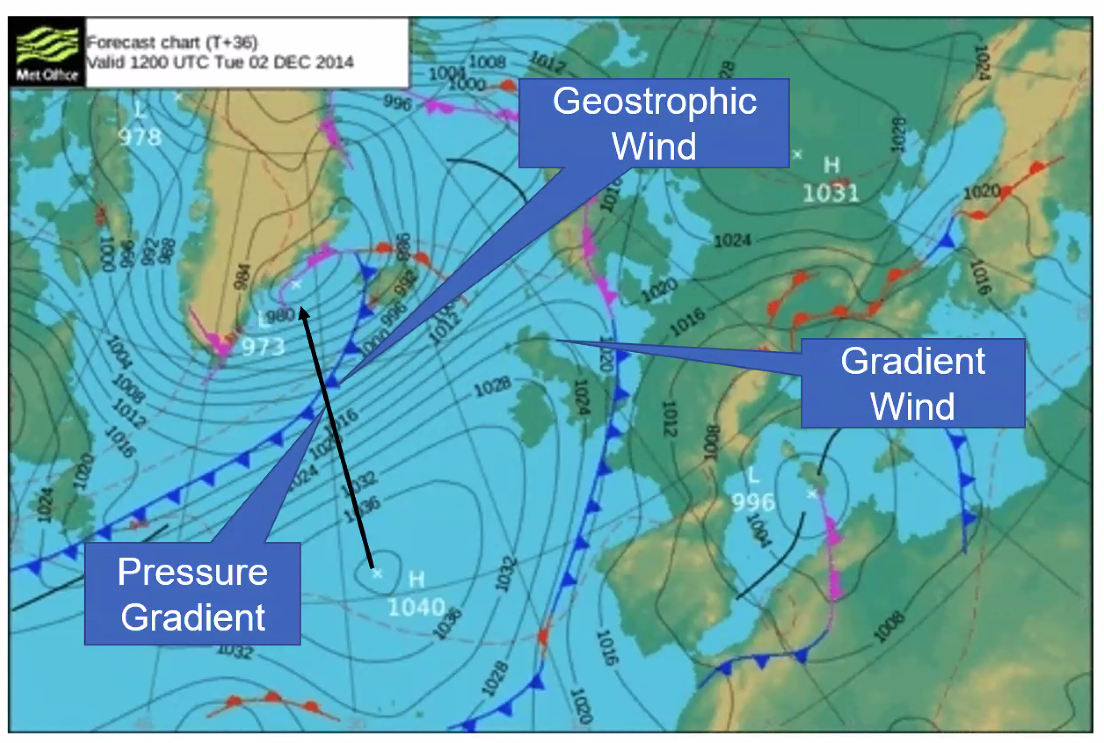
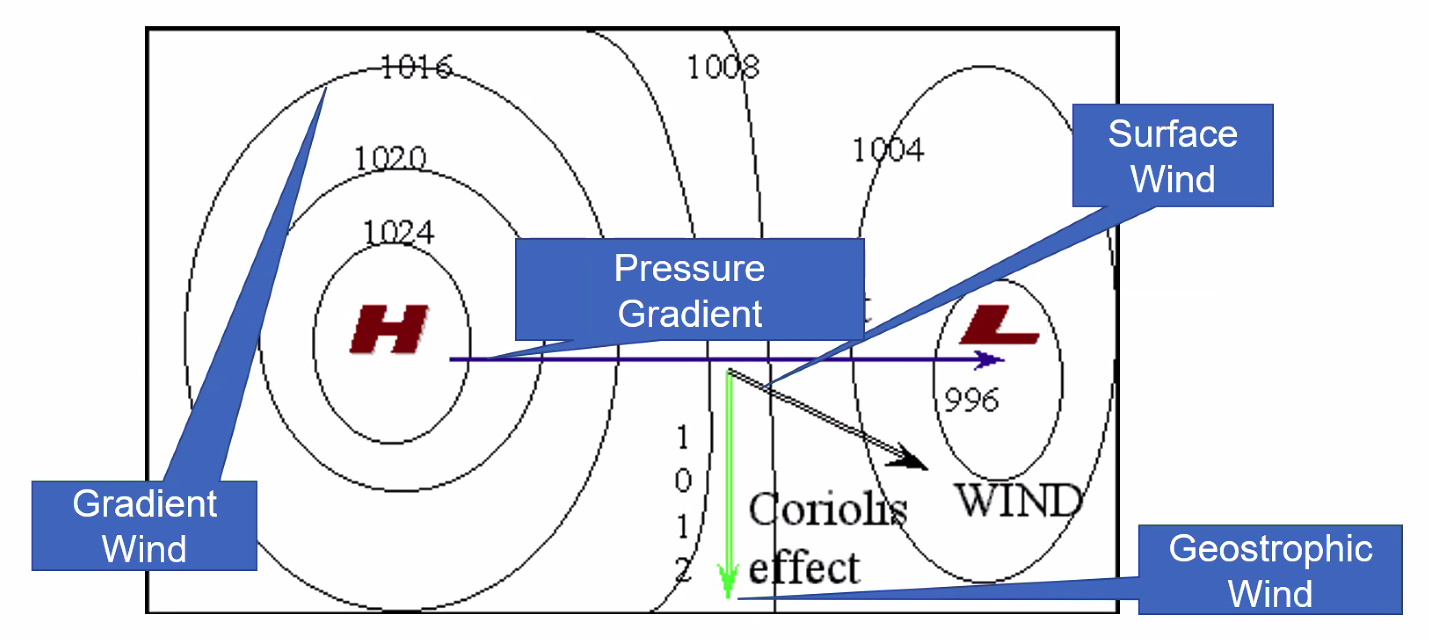
Coriolis Force
==Not actually a force but an effect. Makes moving air turn right in the northern hemisphere and left in the southern hemisphere==
Different parts of the earth move at different speeds. The further from the Poles the faster you will move.
When Coriolis force is imbalanced with the pressure gradient, it will create the Geostrophic wind.
TIP
==“High around a Hi, Low around a Lo”==
Pressure Gradient
==Goes from high pressure to low pressure, acts at right angles to the isobars and is stronger when the pressure gradient is steeper (when the isobars are closer together)==
First thing the air will do when acted on by the pressure gradient force is to start to move across the isobars from high to low pressure. As it starts to move a second force, the Coriolis force, starts to act on it.
Wind Types
Geostrophic Wind
==Blows parallel to straight isobars above the friction layer==
- Wind speeds are higher at altitude
- ==As latitude decreases, wind speed increases==
Q. Which of the following statements best describes the theoretical development of the geostrophic wind in the northern hemisphere? A. D
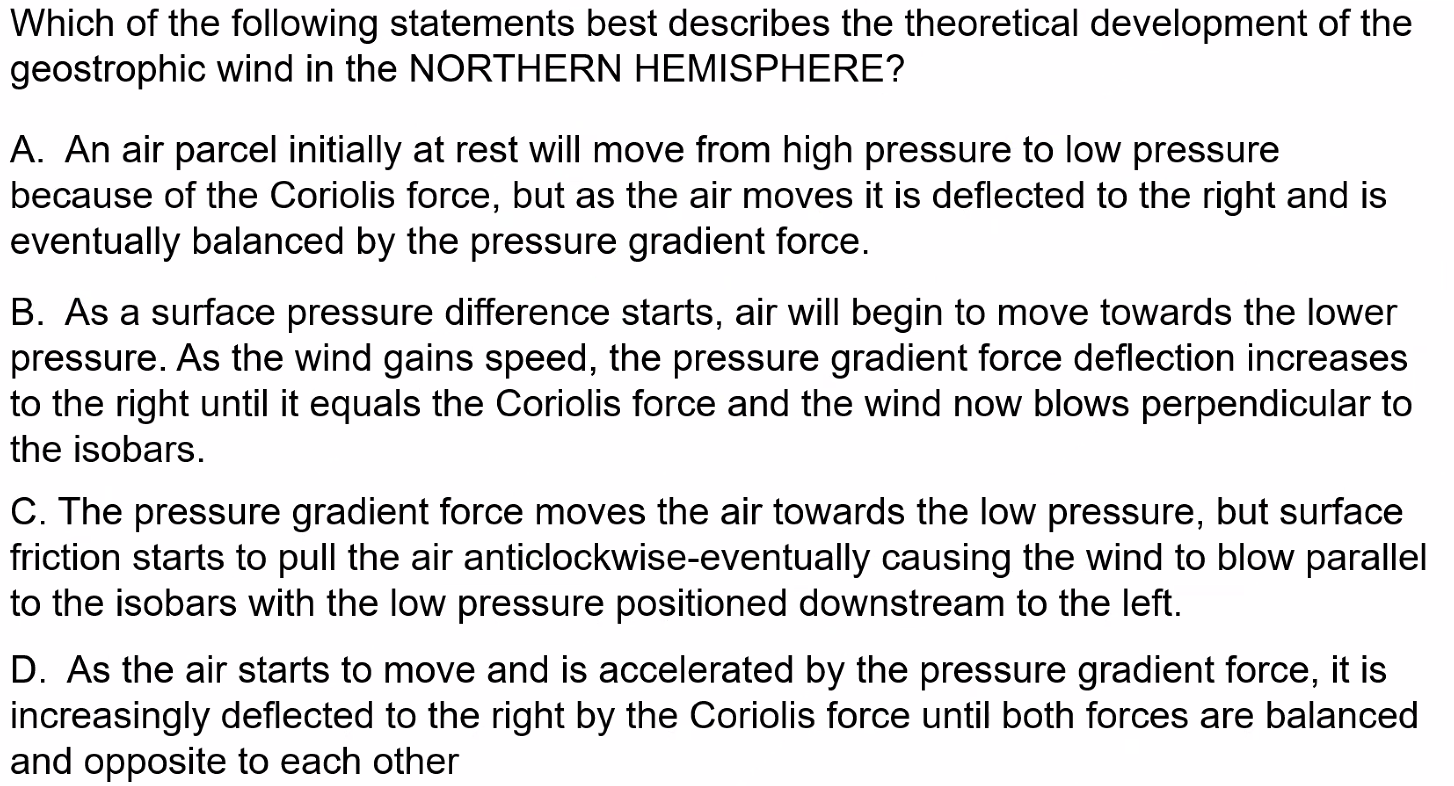
Not B because: doesn’t blow perpendicular to isobars Not C because it’s nothing to do with surface friction Only D can be correct.
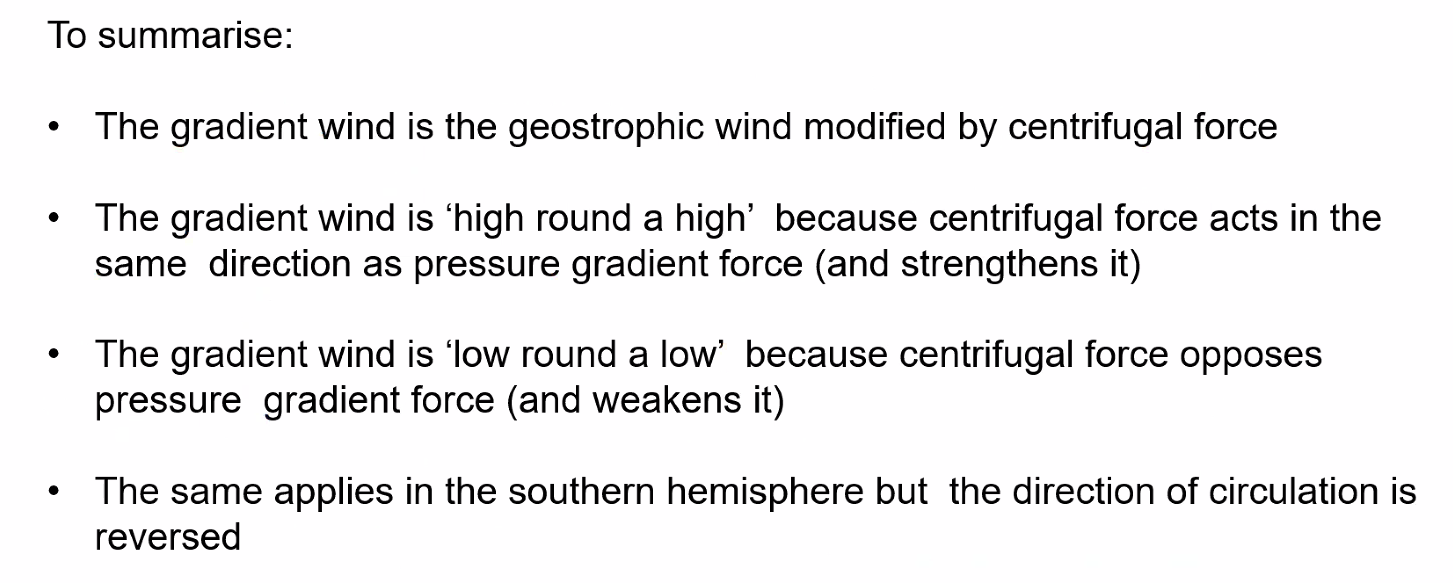
Gradient Wind
Circulating round highs and lows
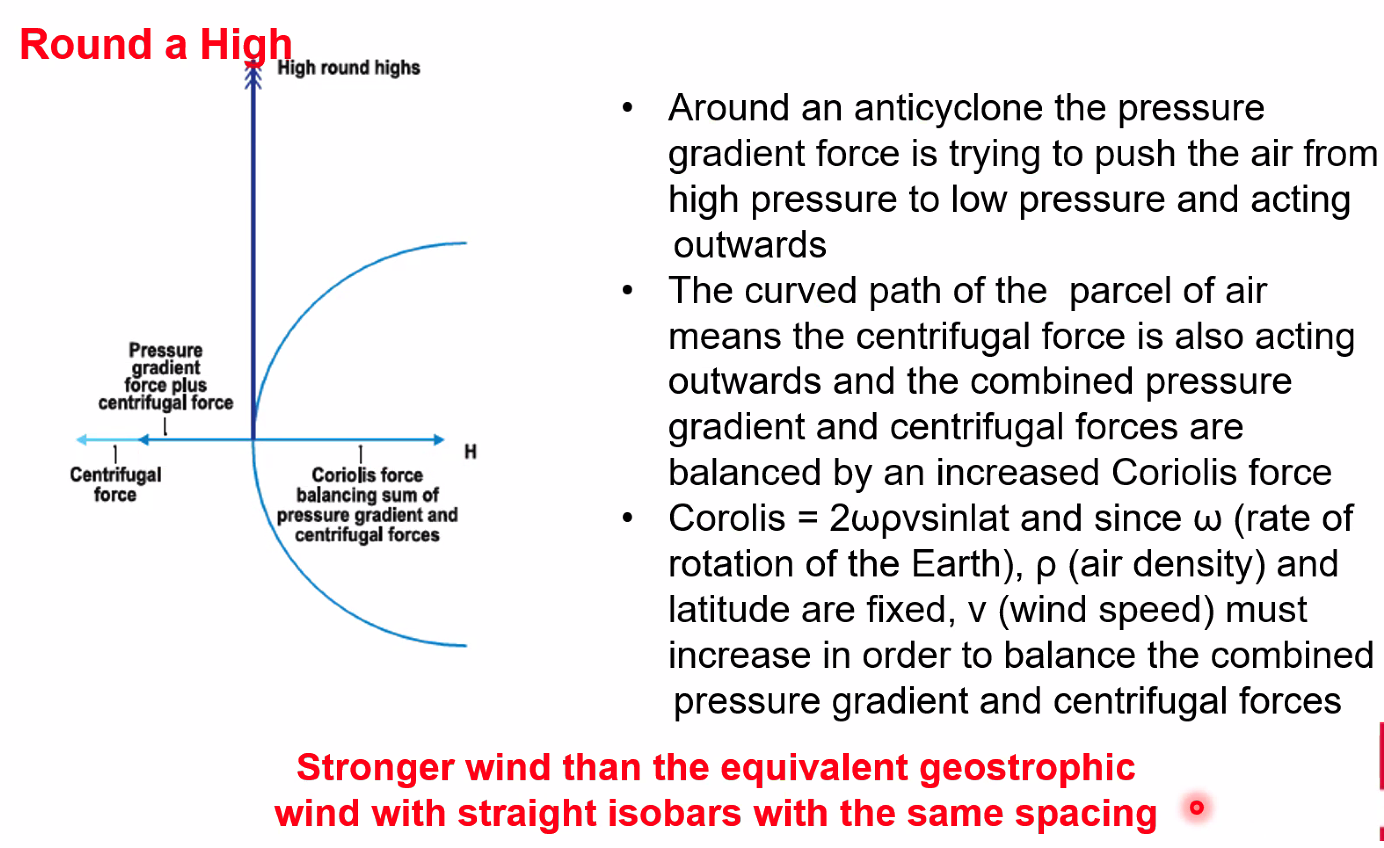
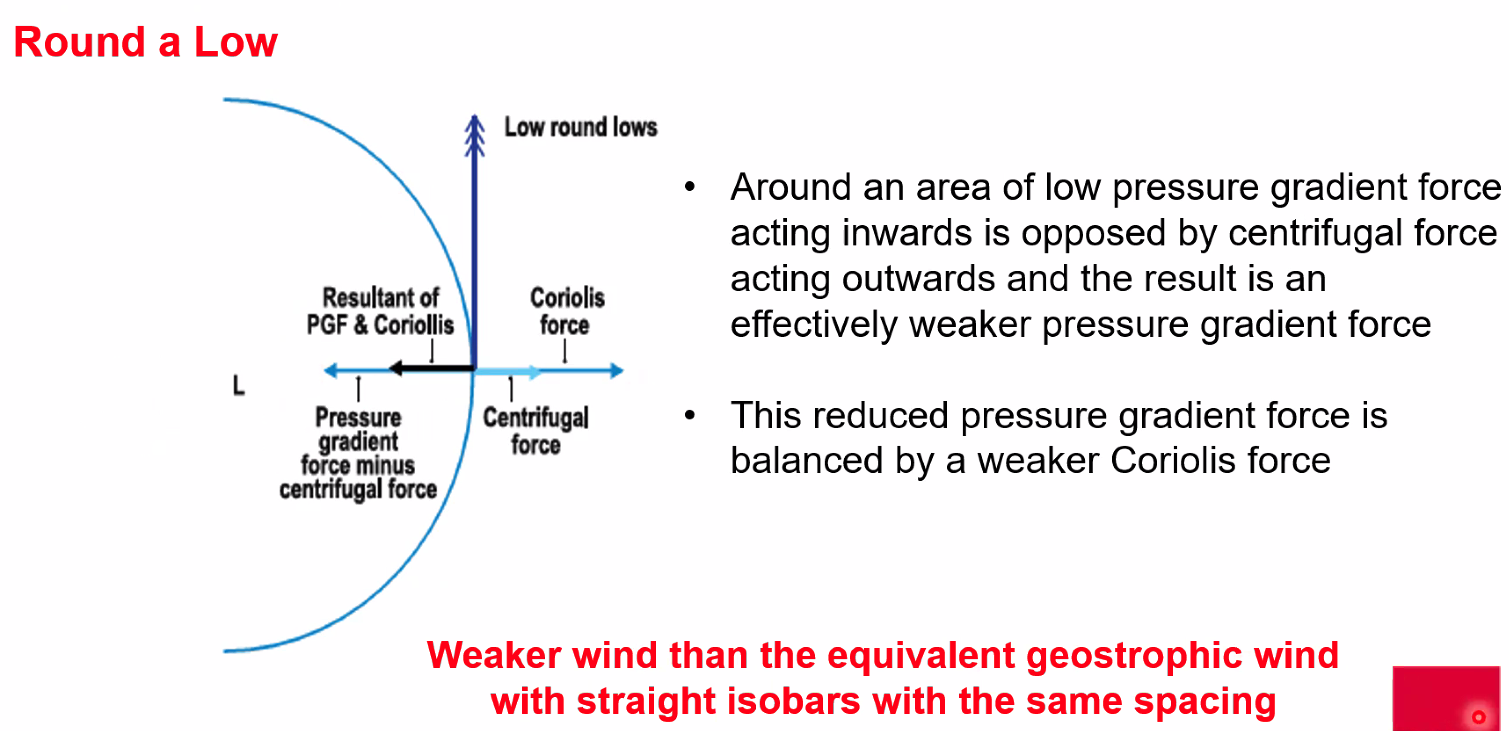
==Gradient wind is the geostrophic wind modified by the centrifugal force==
The geostrophic wind is higher around a high because the pressure gradient force is combining with the centrifugal forces. (Wind moving from high to low is combining with the centrifugal force)
Surface Wind
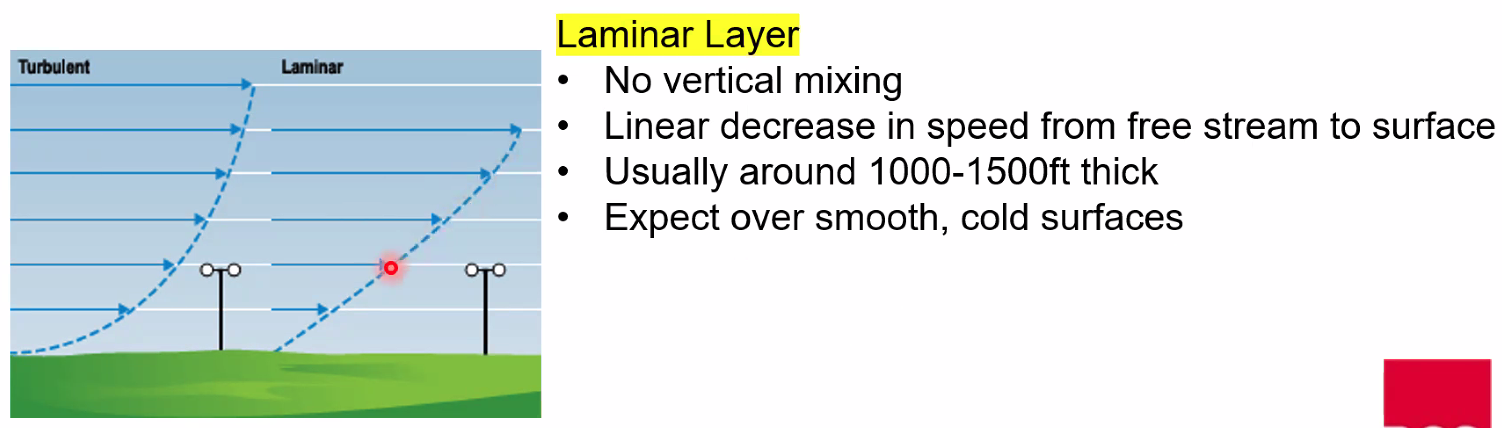
Friction Layer
- ==Air flowing over a surface will have a boundary layer in which surface friction will slow the air==
- Boundary layer often called the friction layer
- The amount of ‘slowing’ depends on wind speed, drag of the surface, and the conditions of the boundary layer (stable or unstable - deeper boundary layer in unstable air)
- Boundary layer can be laminar or turbulent
Surface Wind Measurement
==ICAO recommends that surface wind should be observed at a height of approx 10 m above the runway==
==Reported wind is an average wind derived from measurements with an anemometer at this height of 10 m, average taken over 2 min for local routine and special reports==
Surface Wind Direction
Blows across the isobars in the general direction of the low:
Wind Speed Reduction at Surface
Wind speeds at the surface in relation to the low level free stream wind:
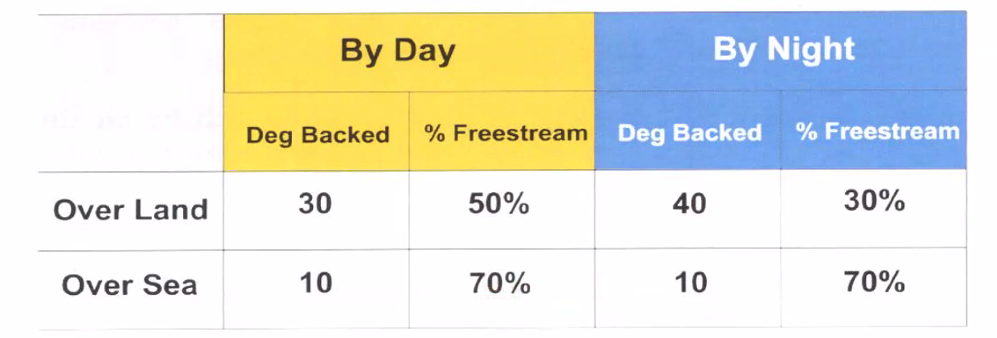
Example: A freestream wind of 270°/40 would become over land by day 240°/20 and by night 230°/12
NOTE
Don’t need to remember the by night values (not in the LO)
Topographic Effects
Katabatic Winds
==Flow down the sides of hills and mountains at night or on very cold days when there is no strong gradient wind to hide the effect==
- The cold surface cools the air in contact by conduction, and the colder and more dense air begins to slide down the mountain
- Can be quite strong
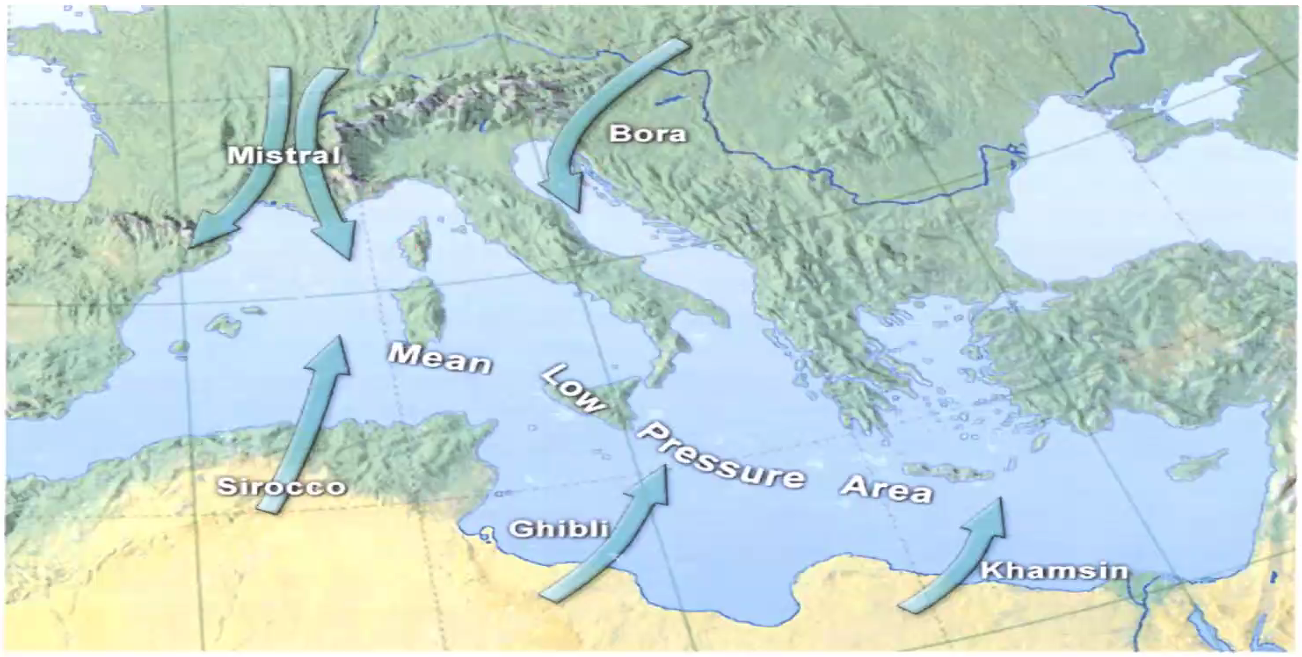
The Bora: ==Flows off the Alps into the North Adriatic, is a katabatic wind and can be as high as 70 kts==
Anabatic Winds
==Flow up the sides of mountains when the surface is hot, during the day==
- The air in contact with the surface is heated by conduction, and the less dense air slides up the hill
- The heated air tends to flow straight up rather than on the sides of the mountain
Valley Winds
==Caused by the venturi effect. Pressure drops but the speed increases==
- When mountain barriers make the winds flow down valleys the effect is the same as for a Venturi
- These reach speeds of over 60 kt at about 5,000 ft (one-sided valley winds)
Föhn Wind
==Produces warm, dry winds in the lee of mountains==
Named Winds
European Winds
Bora: ==A northern to north-eastern katabatic wind in the Adriatic==
Mistral: ==A strong, cold northwesterly wind that blows from southern France into the Gulf of Lyon in the northern Mediterranean==
Sirocco: ==A Mediterranean wind that comes from the Sahara and can reach hurricane speeds in North Africa and Southern Europe. Mainly in the winter==
Ghibli: Libyan name for the Sirocco
African and Middle Eastern Winds
Khamsin: ==A dry hot sandy local wind, blowing from the south in North Africa and the Arabian Peninsula==
Harmattan: ==A dry and dusty north-easterly trade wind which blows from the Sahara desert over the west African subcontinent into the Gulf of Guinea between the end of November and the middle of March==
North American Winds
Chinook: ==A föhn wind in the interior West of North America, where the Canadian prairies and great plains meet various mountain ranges==
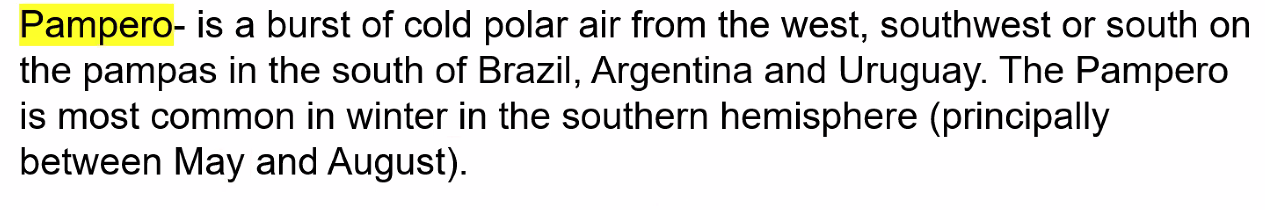
Land and Sea Breezes
Characteristics
- ==Light low level coastal winds==
- Build up and decay throughout the day and night
- ==Caused by the land warming and cooling more quickly than the sea==
- ==Form in clear summer weather with a slack pressure gradient==
- Small sea breeze front may form
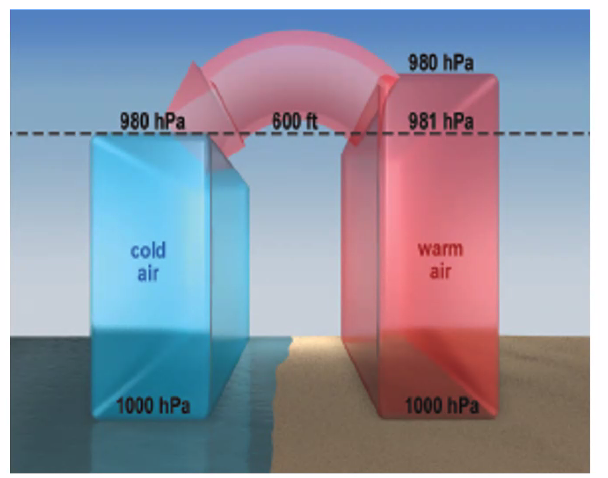
Direction
- ==Blows from the land to the ocean in the evening/night (not frequent)==
- ==Blows from the ocean to the land in the afternoon==
Q. An aircraft is approaching under visual flight rules an airfield (NH) whose runway is parallel to the coast. When downwind over the sea, the airfield is on the right. What wind effect should be anticipated on final approach and landing during a sunny summer afternoon? A. Crosswind from the right
Winds in the upper atmosphere
Jetstreams
- The pressure pattern at height is unlikely to be the same as that on the surface
- Major reason is that columns of air at different temperatures lead to pressure differences at height
Contour lines - isohypses
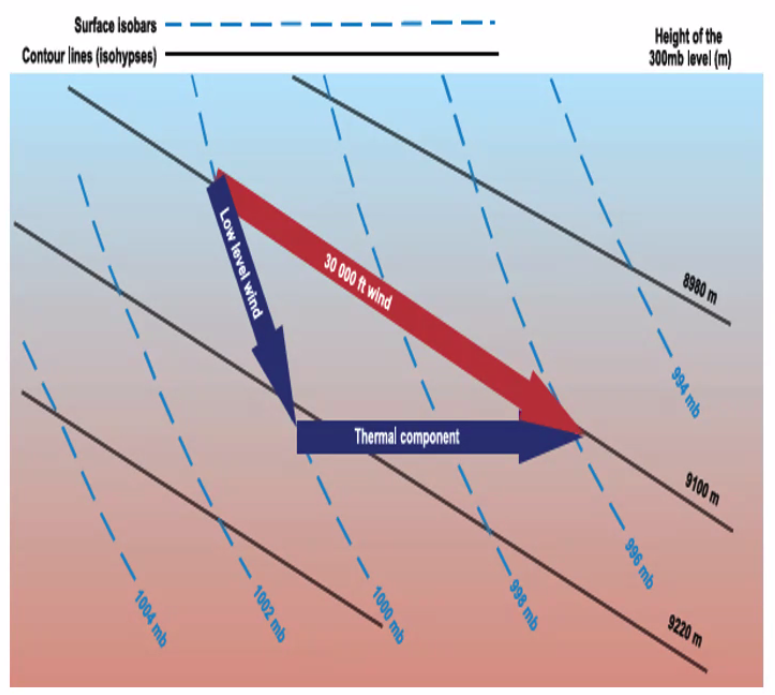
The high level wind is made up of two components:
- the wind at low level is caused by the differences in surface pressure
- the thermal component is caused by the differences in temperature at height
The low level wind blows parallel to isobars with low pressure on the left in the northern hemisphere. The thermal wind component blows parallel to isotherms with low temperature on the left in the NH The upper wind blows parallel to contours with low contour height
Wind blows clockwise around high pressure and anti-clockwise around low pressure
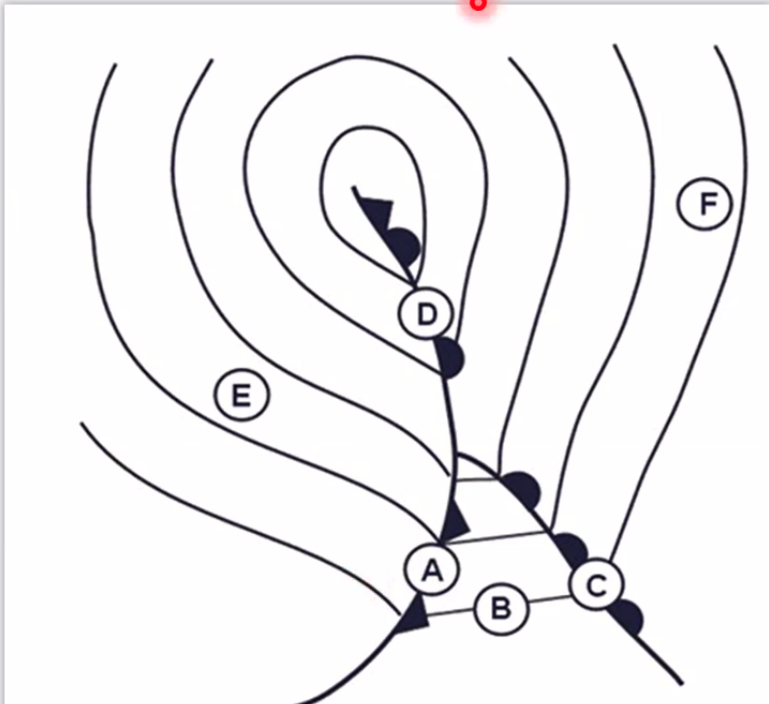
Upper winds blow along contour lines Upper winds are strongest where the contours are closest together.
The strongest winds speeds occur, where the contours are closest together, would occur at point A on the diagram.
Jetstreams
- Wind speed must be more than 60kt
- Will only show on sig weather charts when speed is above 80kts
- Depth to width ratio of 1:100, 2nm deep and 200nm wide.
- Typically a jet stream is 2nm (12000ft) deep and 200nm wide.
- Typically jet streams are 1000nm long
- actual length depends on the extend of the thermal contrast
- Found in the warmer of the two columns of air, just below the warm air tropopause
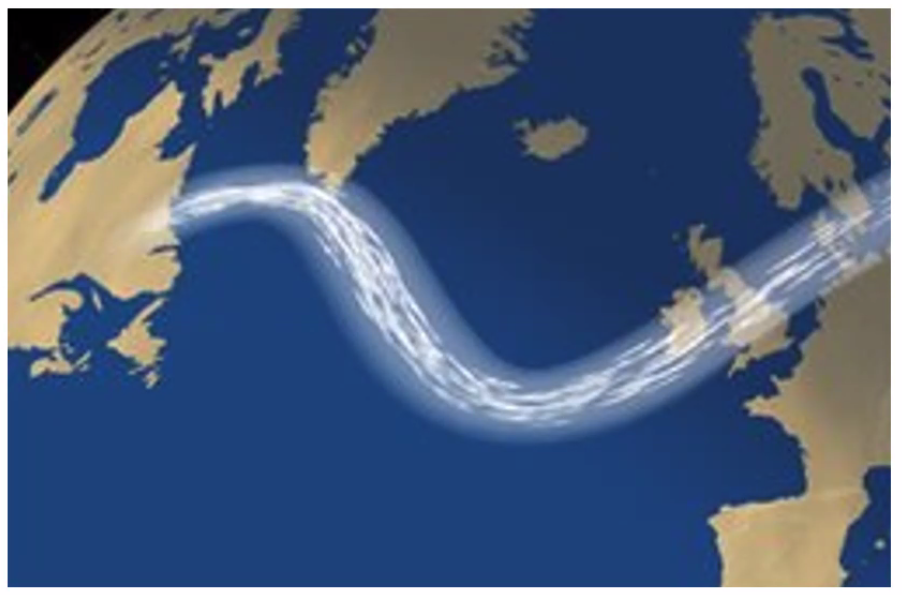
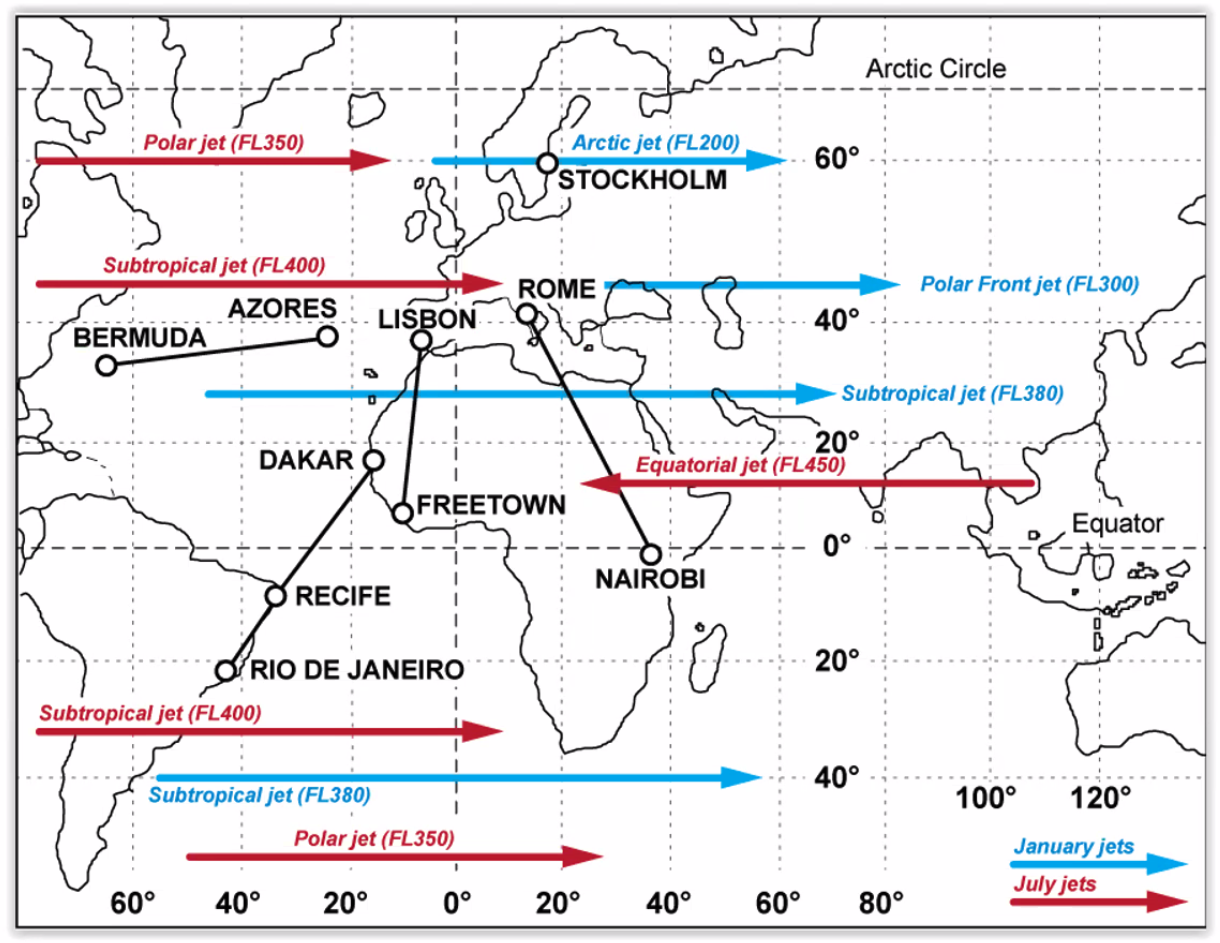
The main ones:
- Polar front jet
- Sub-tropical jet
- Arctic front jet (winter only - BLUE)
- Tropical easterly jet (summer only - RED)
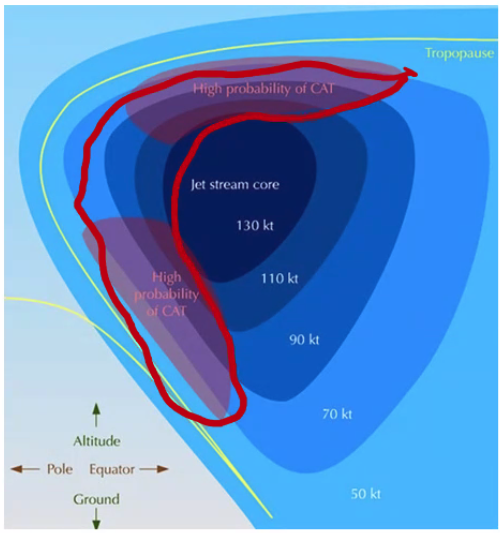
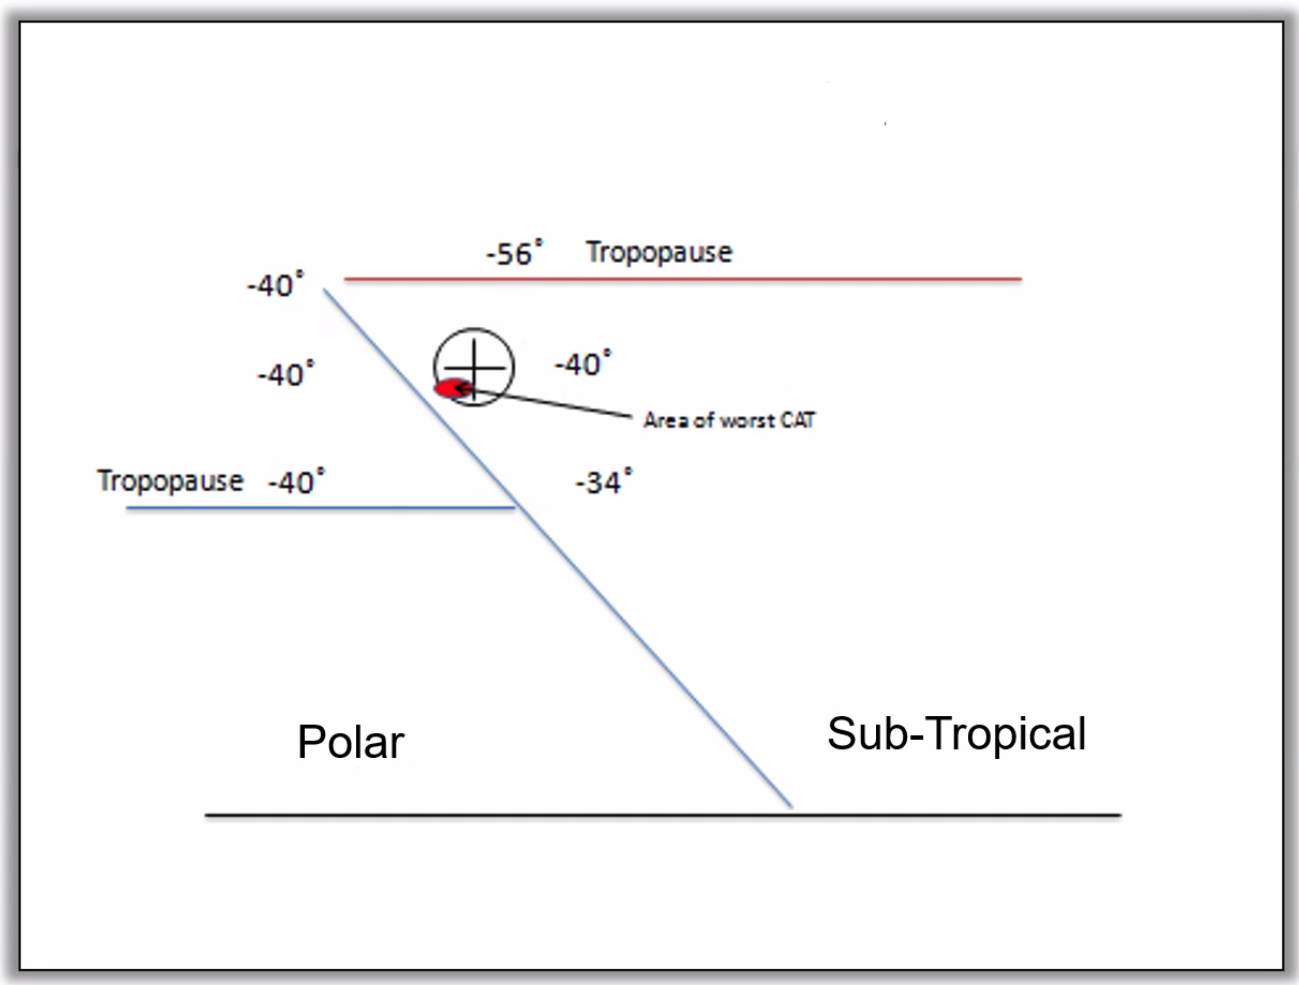
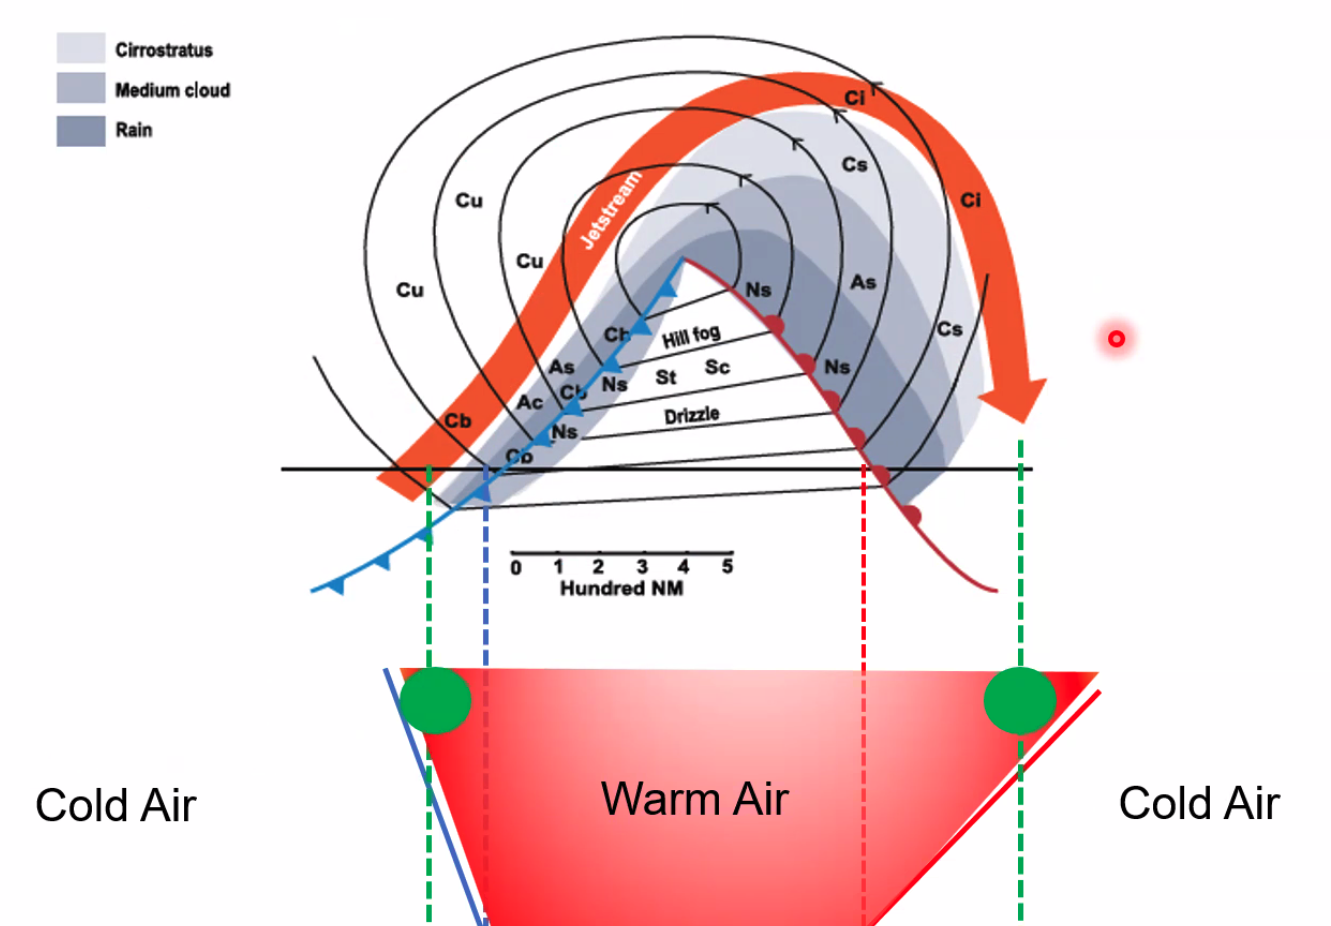
Associated with Jetstreams is Clear Air Turbulence
Most clear air turbulence is found in the alley between the two bodies of air (above where it says troposphere in the below diagram). Below diagram shows isotaches (lines of equal speed).
Around the jet stream the air temp on both sides of the jet stream is roughly the same.
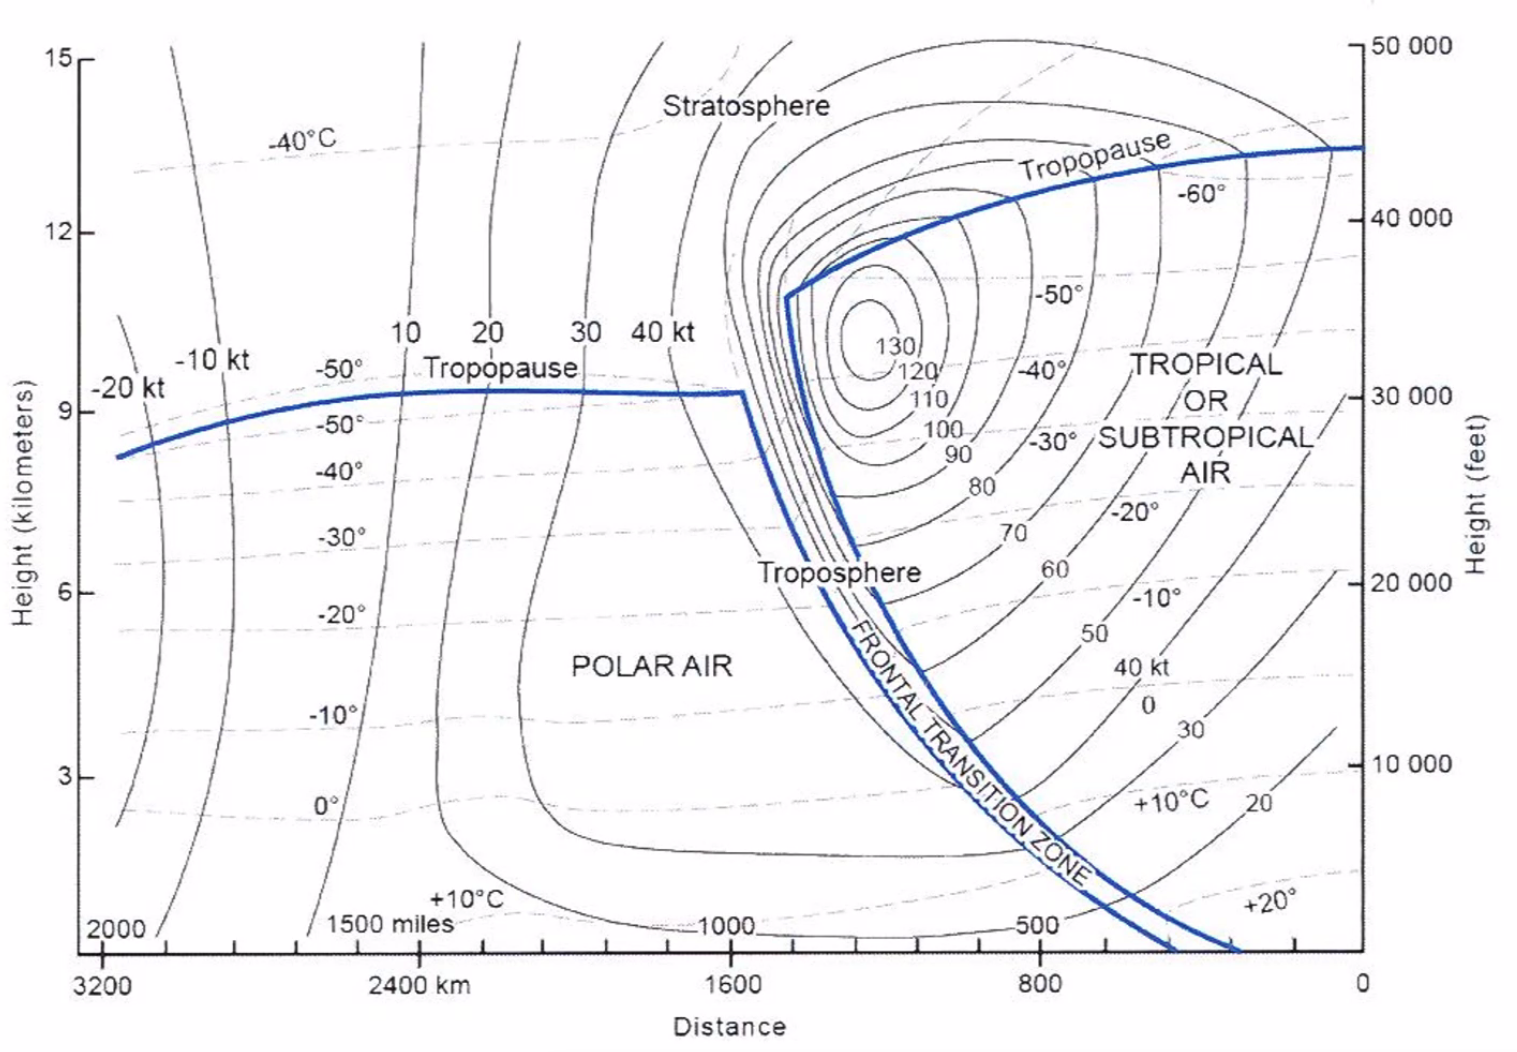
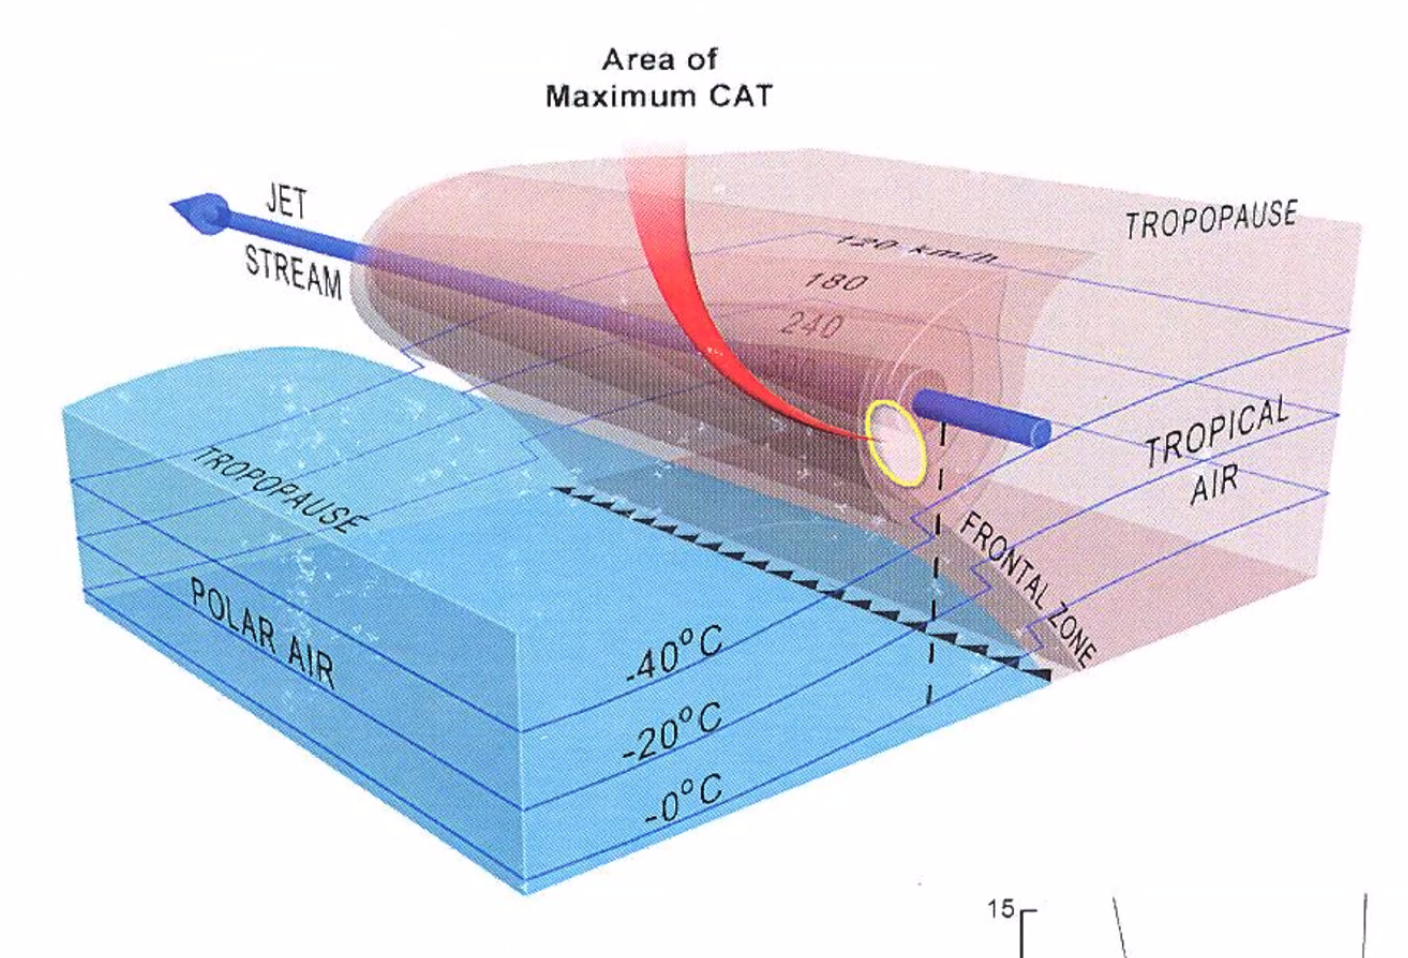
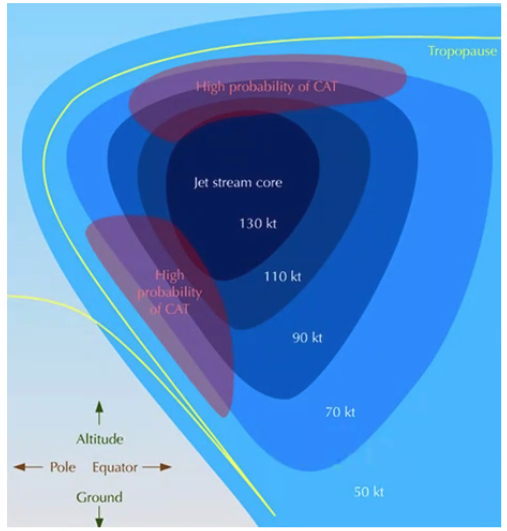
When said on the cyclonic side, it means on the side of the colder air / cold side of the jet.
There’s a exam question that will ask what the shape drawn is: just understand it is the area of clear air turbulence around the jet stream core.
Some questions they’ll ask if what crosswind you’ll get if temperatures are increasing / decreasing, you’ll need to understand which hemisphere you’re in to understand whether a cold front blows
I NEED TO REVISE THIS
==Q. While crossing a jet stream at right angles in Western Europe )3000ft) below its core) and OAT is decreasing, what would be the prevailing wind?== A. From the left.
LO: Occasionally a jet stream of about 70kt can form at about 5000ft above the surface if there is a marked temperature difference between the air masses at that height (typically at night)
Technically, not a jet stream as they do not comply with the WMO definition of a jet stream.
Standing Waves
Mountain waves (or standing waves or lee waves) are defined as oscillations to the lee side (downwind) of a mountain caused by the disturbance in the horizontal air flow caused by the high ground.
Mountain Wave - the wavelength and amplitude of the oscillations depends on many factors including the height of the high ground above the surrounding terrain, the wind speed, and the instability of the atmosphere.
Conditions required
- Wind direction within 30deg of the perpendicular to the ridge of high ground and no change in direction with height
- Wind speeds at the crest of the ridge must be in excess of 15kts, increasing with height
- stable air above the crest of the ridge with less stable air above and a stable layer below the ridge
- the strongest waves occur where there is a very strong stable layer, perhaps an inversion, at ridge height, with rather less stable air, but not unstable air, above and below.
- Vertical currents within the oscillations can reach 2000ft/min. the combination of these strong vertical currents and surface friction may cause rotors to form beneath the mountain waves causing severe turbulence
Use visual signs and met forecasts to predict these - especially in light aircraft and helicopters
Mountain waves are associated with severe turbulence, strong vertical currents and icing in the cloud associated with the waves The vertical currents can make it difficult to maintain the correct altitude Loss of control can also occur Aircraft structural damage resulting from an encounter of severe clear air turbulence Severe iciing can be experienced
LO: Describe that mountain wave effects can exceed the performance or structural capability of the aircraft
LO: Describe that mountain wave effects can propograte from low to high level
LO: State that remote sensing of CAT from satellites is not possible and forecasting is limited
LO: State that pilot reports of turbulence are a very valuable source of information as remote measurements are not available
==PIREP - Pilot Report==
Visual Cues:
- Lenticular clouds - lens clouds
- Roll clouds - don’t always see it based on moisture in the air.
- Cap clouds - on the mountain side
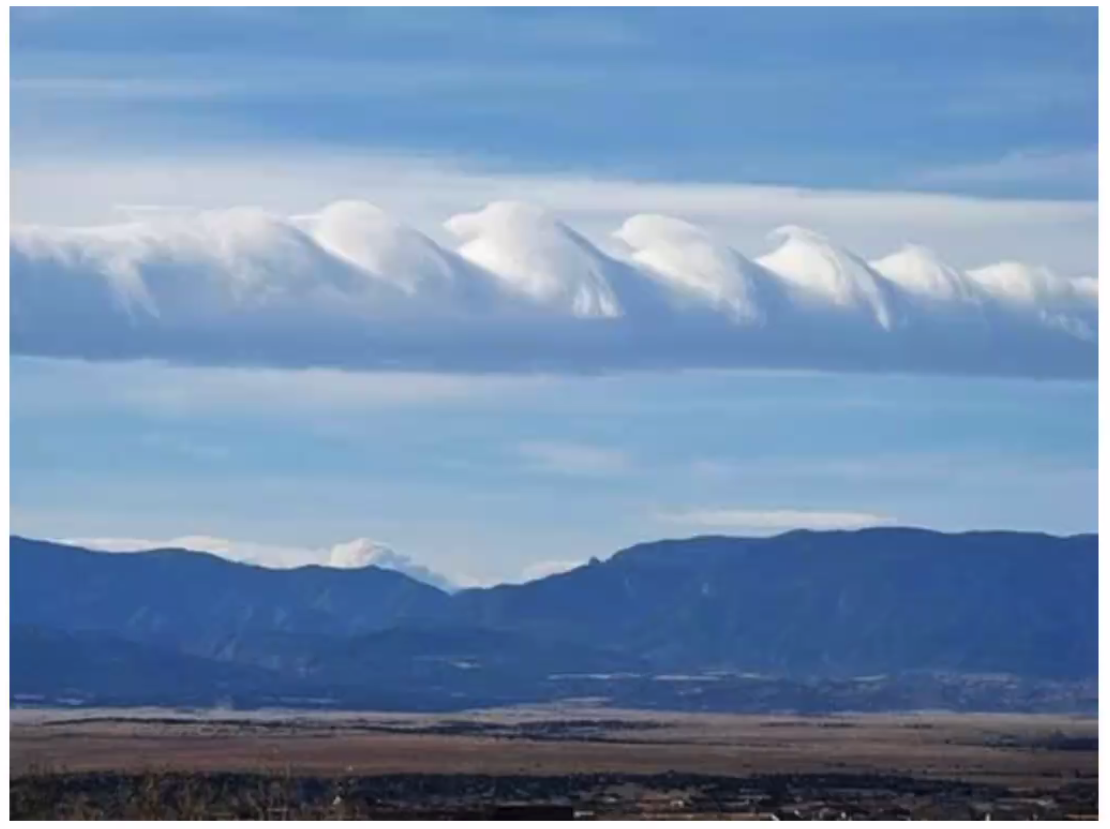 Roll clouds
Pressure Systems and Fronts
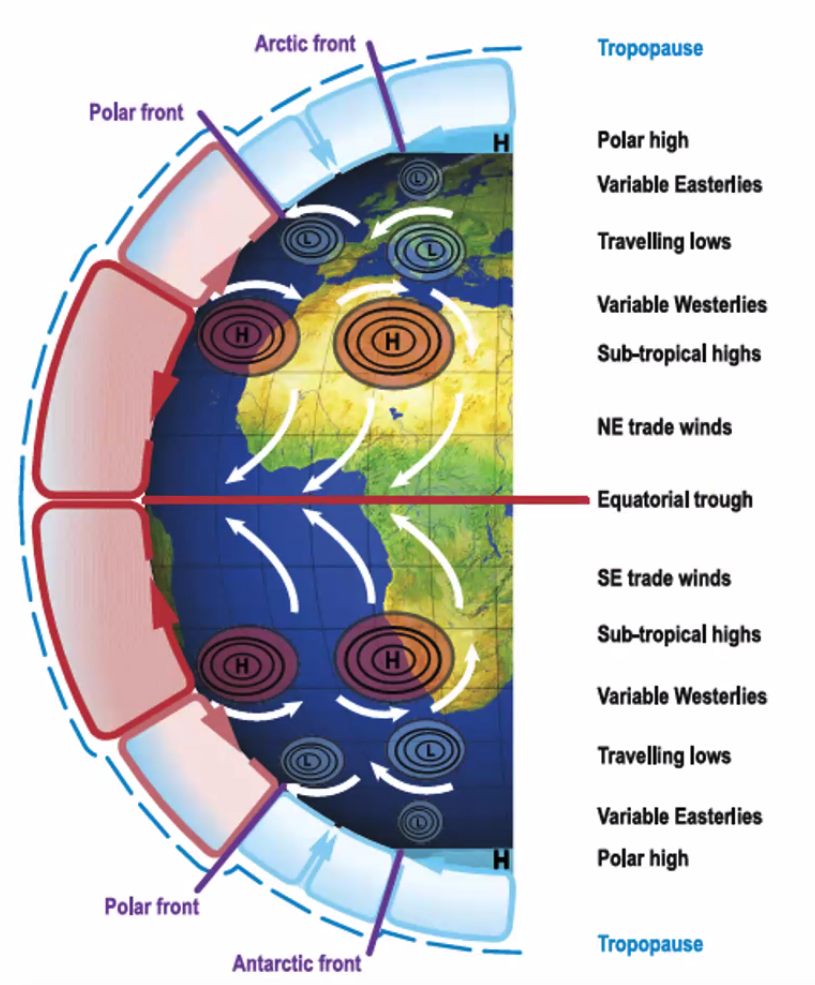
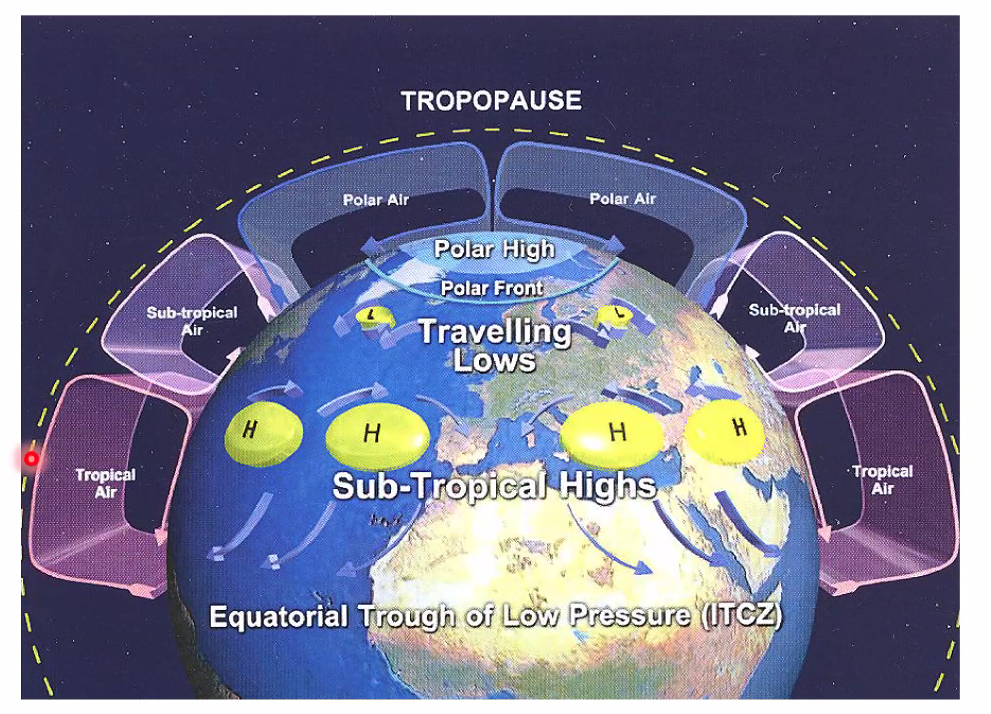
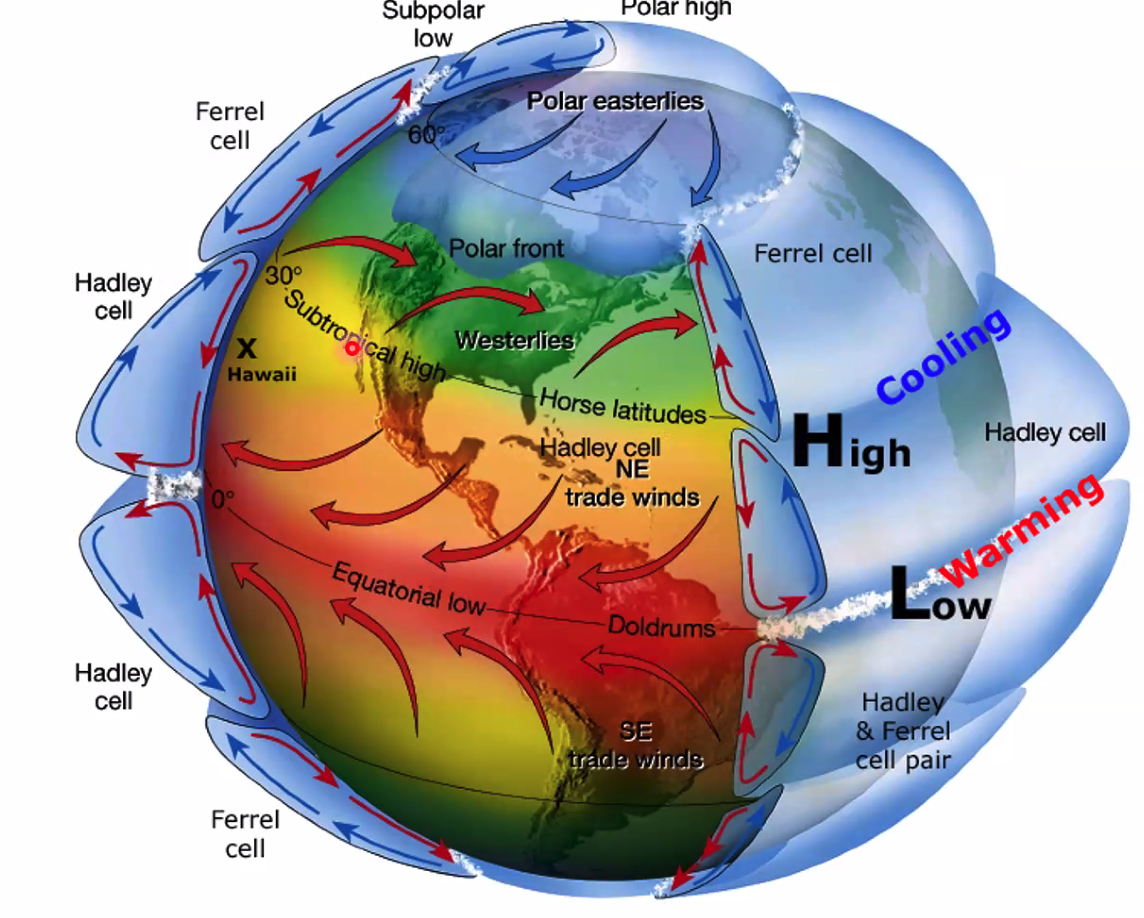
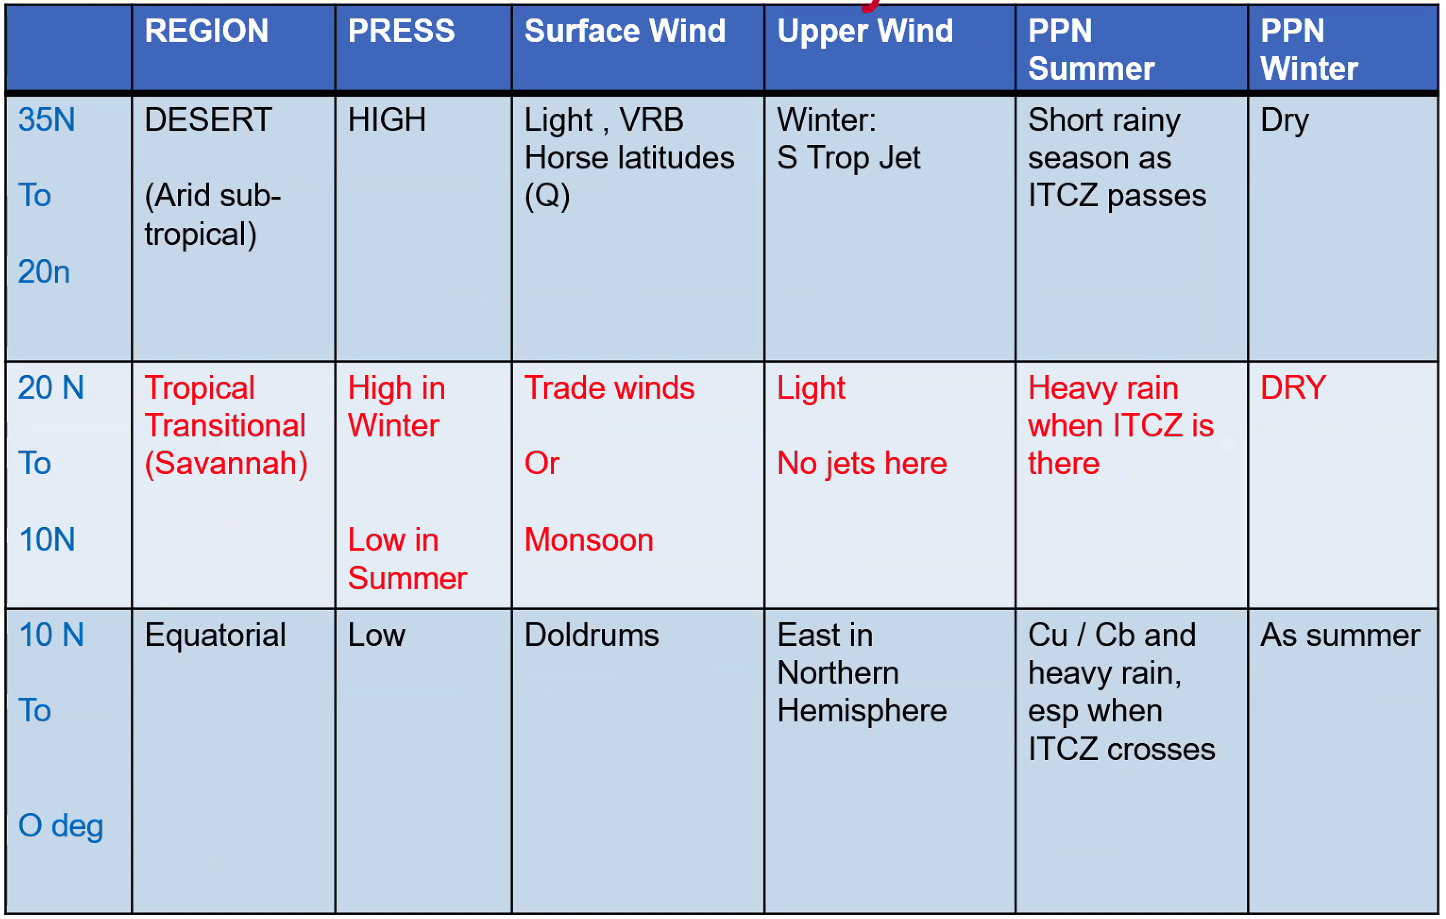
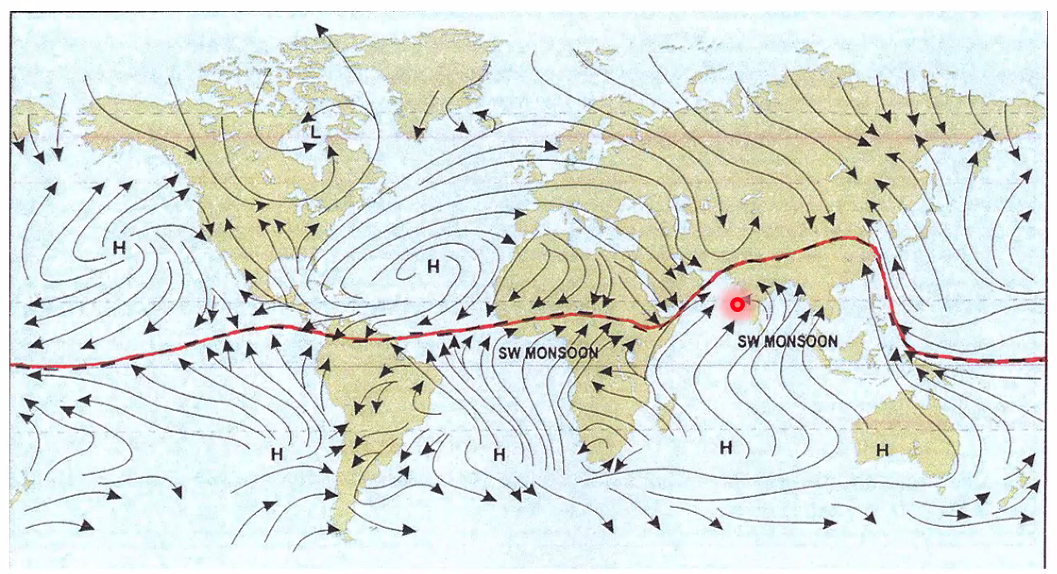
A band of tropical convection and rain at the equator with winds converging to the equatorial trough from the north east and south east - the trade winds
Bands of high pressure systems at about latitude 30deg giving fine, dry weather
On the polar side of the high winds from the west bringing the band of travelling lows and temperature weather.
Closer to the poles we would expect snow and cold weather from the arctic from and then finally good weather from the poles.
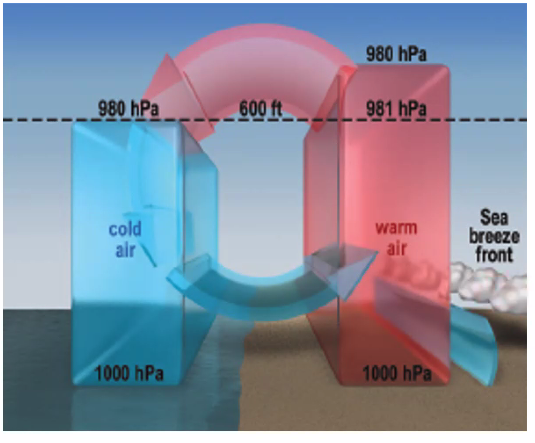
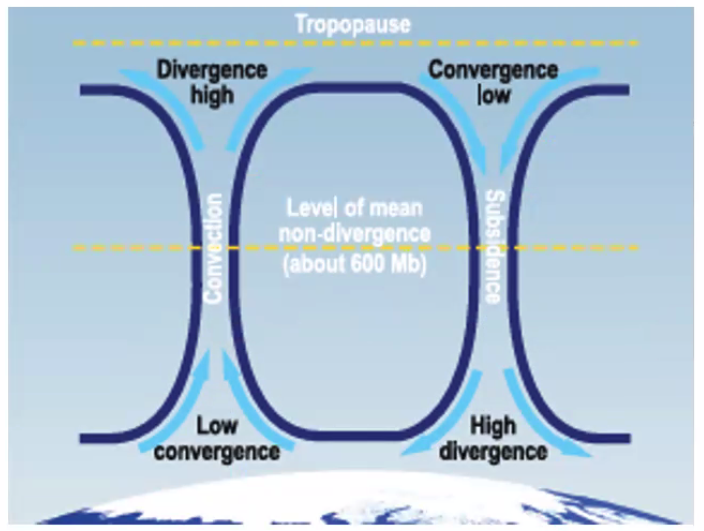
Convergence and Divergence
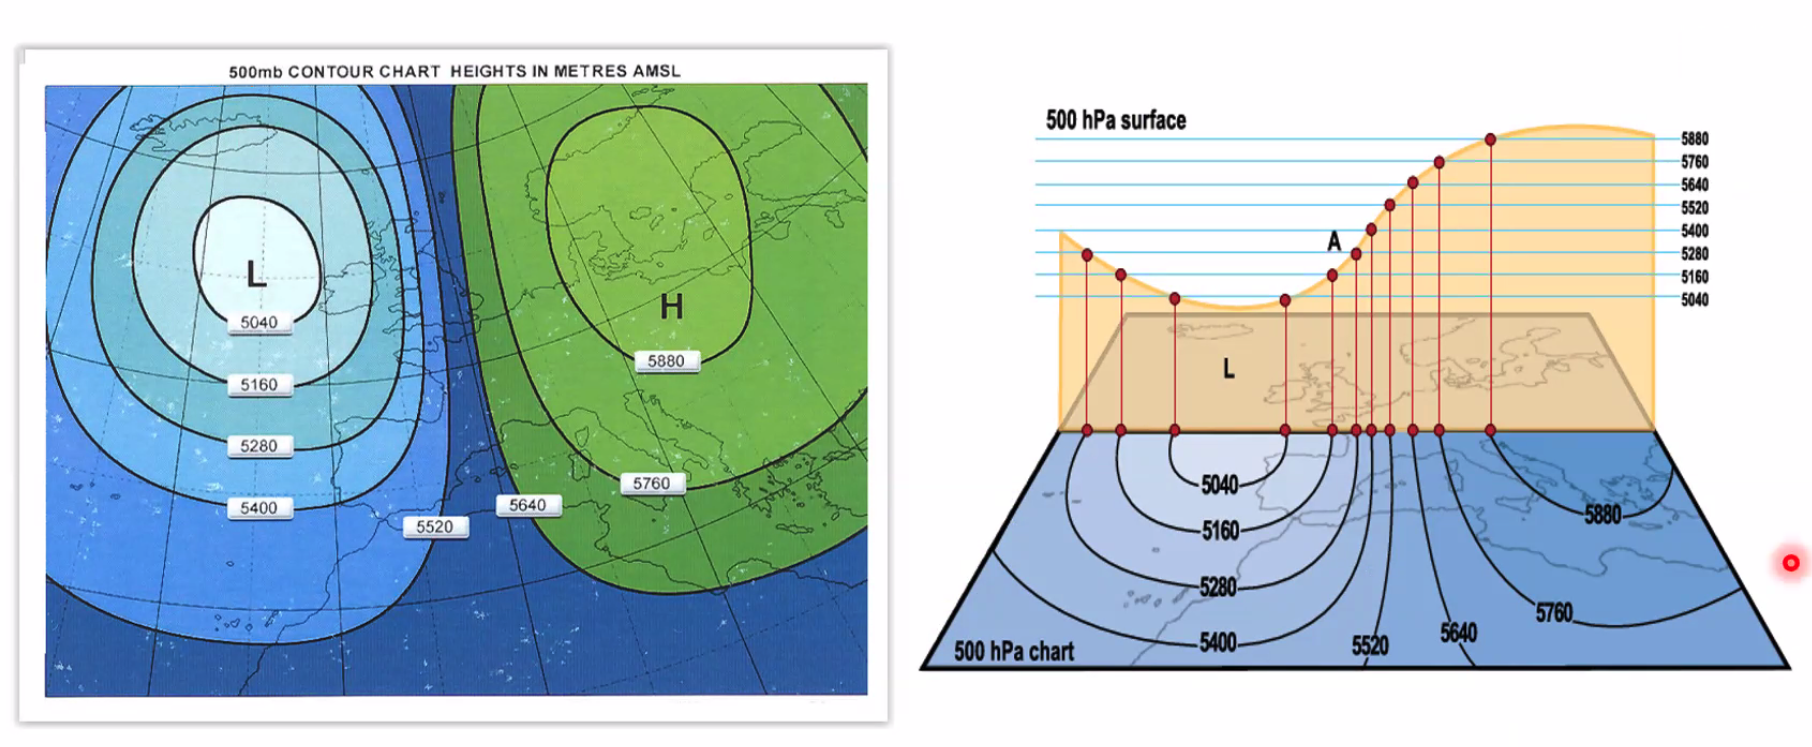
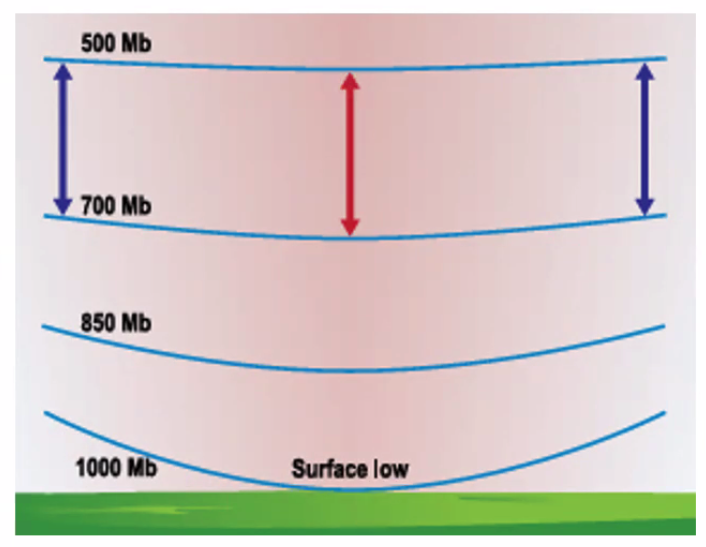
In general, active pressure systems the pressure pattern on the surface is the opposite at the tropopause level. At halfway up / down when the air converges or diverges it is known as the barostatic level. Can be as low as 10000ft/ 700hPa
Highest pressure level considered is 500hPa around 18000ft. It is important to specify the level or levels that are being considered
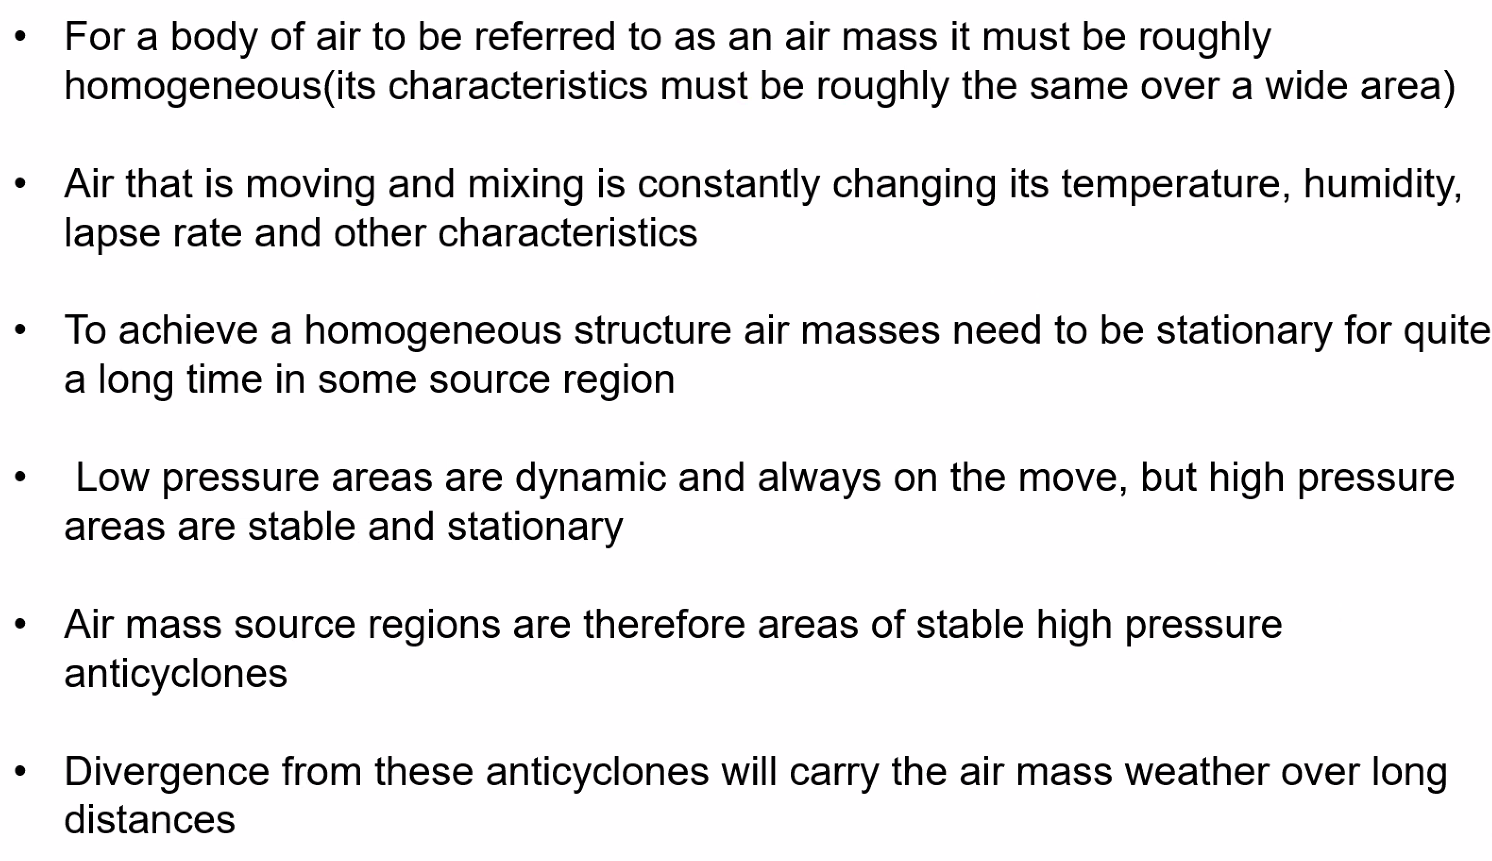
Cyclone - met name for low pressure systems where the circulating air moves in the same direction as the earths rotation, anti-clockwise in the NH and clockwise in the SH. Commonly called lows or depressions.
Depressions can be classified according to the way they form:
- Frontal depressions - along the line of the polar front
- Orographic depressions - formed by the swelling of airflow behind hills and mountains
- Thermal depressions - surface heating
- Cold air lows - sometimes called polar lows associated with small scale instability develiping in polar airflow.
Orographic Depressions (aka as a lee depression, a lee trough or a lee low) Low pressure feature, forms to the lee of a mountain barrier when air flow is at right angles to the barrier.
Air column is squashed by vertical contraction as it crosses the barrier. Often seen in the lees of the Rocky Mountains and to the south of the western Alps under a northly flow. Generally produce little weather apart from orographic cloud due to the Fohn effect. Sometimes more significant weather if a cold front is also passing.
Typically get high convective activity / thunderstorms / shows etc. But does dissipate when the warm air is displaced by the cold.
Thermal Lows
Thermal lows form when the surface is hot.
Low level air is heated and rises to be replaced by inflowing surface air - convergence - leading to a final situation where there is a low level converge to a low pressure area
Cyclonic circulation, and high pressure and divergence aloft
Thermal lows are warm lows with a core warmer than the environment
Small scale thermal lows are often too small to appear on a surface chart. Large scale thermal lows can occur over large land masses in summer - North American Low & Asian Low (India, Bangladesh, China, Mongolia) & ITCZ (more global)
High surface temperatures do not automatically lead to low pressure and convection - because the environmental lapse rate is so low and the air mass is so stable that heating is confined to a shallow layer.
Cold Lows Cyclones can be classified as warm or cold lows depending on whether the core at a particular level is warmer or colder than the surrounding environment.
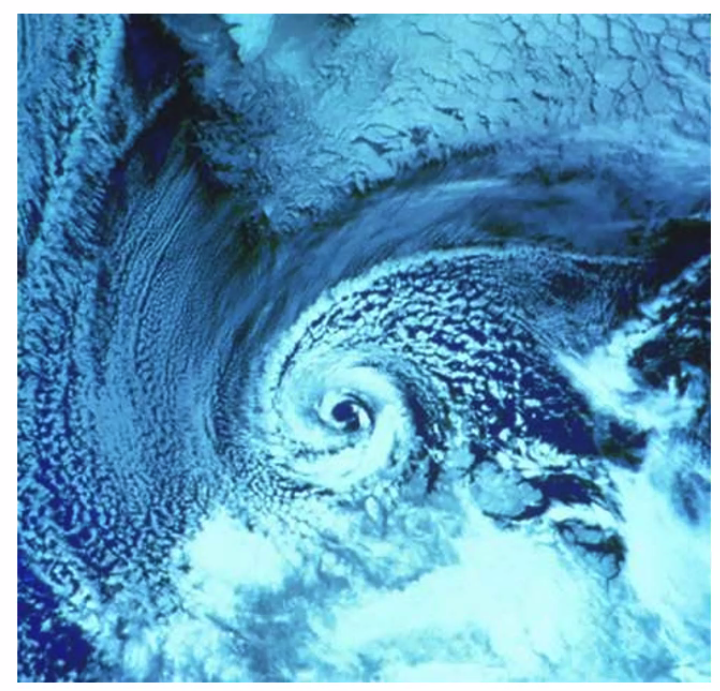
Polar Lows:
relatively small scale non-frontal low pressure system found most in winter at high latitudes. It is a secondary depression that forms over oceans poleward of the polar front and can produce blustery snowy conditions. Extensive cumulonimbus clouds are often associated with cold pools in the mid- to upper troposphere.
High Pressure Systems: Anticyclones - clockwise in NH or anti-clockwise in SH
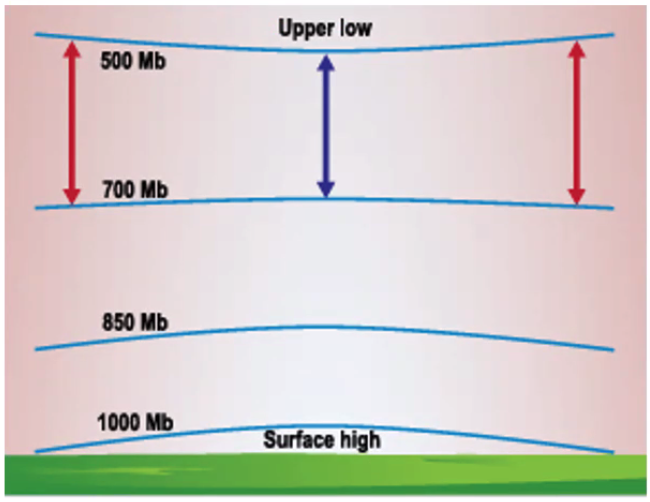
Defined as warm or cold highs.
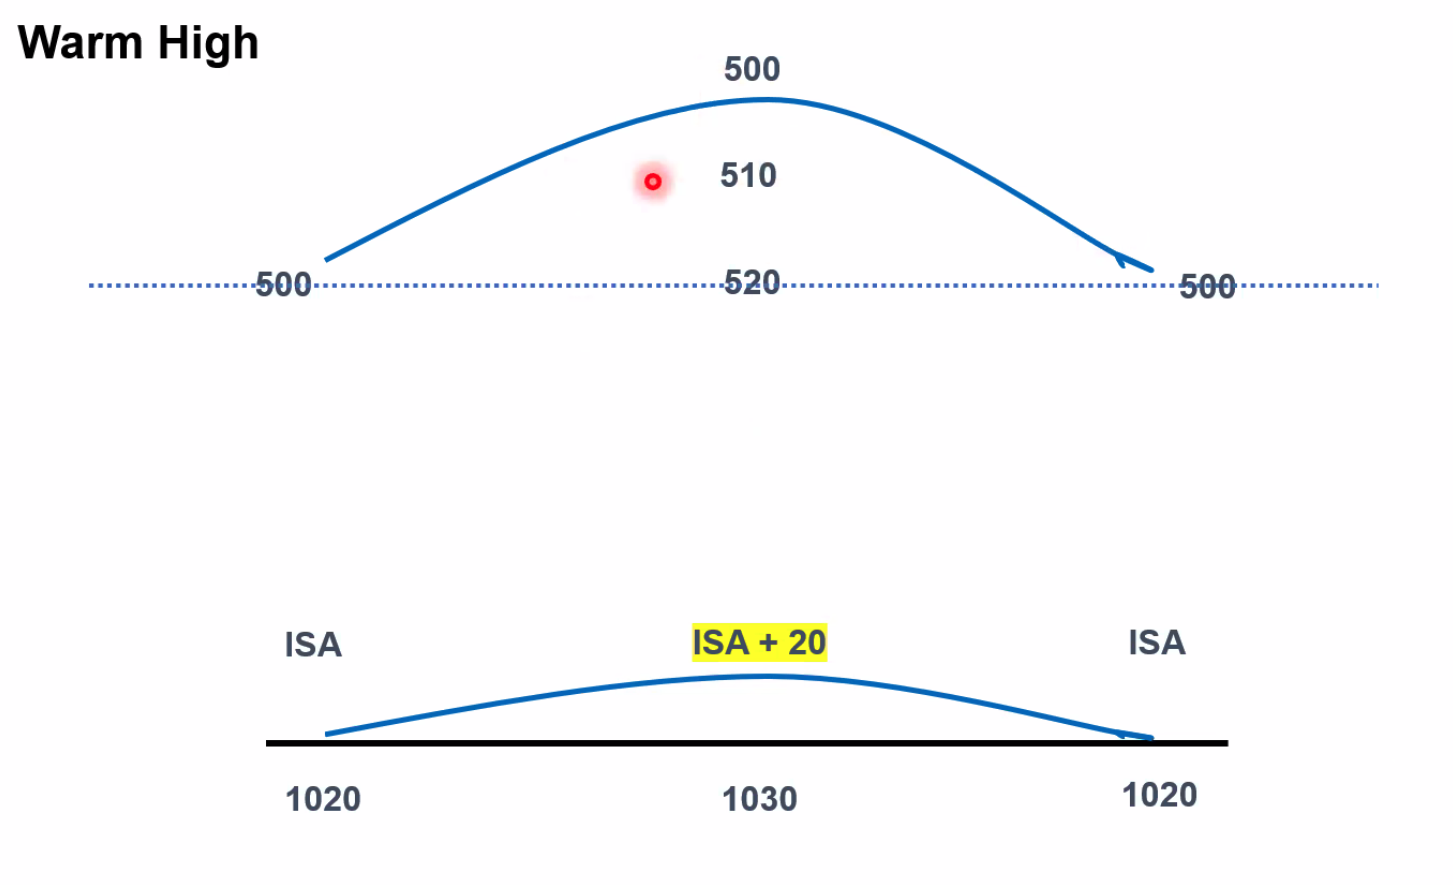 Warm high, pressure planes bulge upwards and intensifies aloft.
Warm highs are often called ‘blocking high’ because they are nearly stationary and are effectively blocking low pressure systems from coming through. All a block does is keep weather the same for a few weeks.
Warm high, pressure planes bulge upwards and intensifies aloft.
Warm highs are often called ‘blocking high’ because they are nearly stationary and are effectively blocking low pressure systems from coming through. All a block does is keep weather the same for a few weeks.
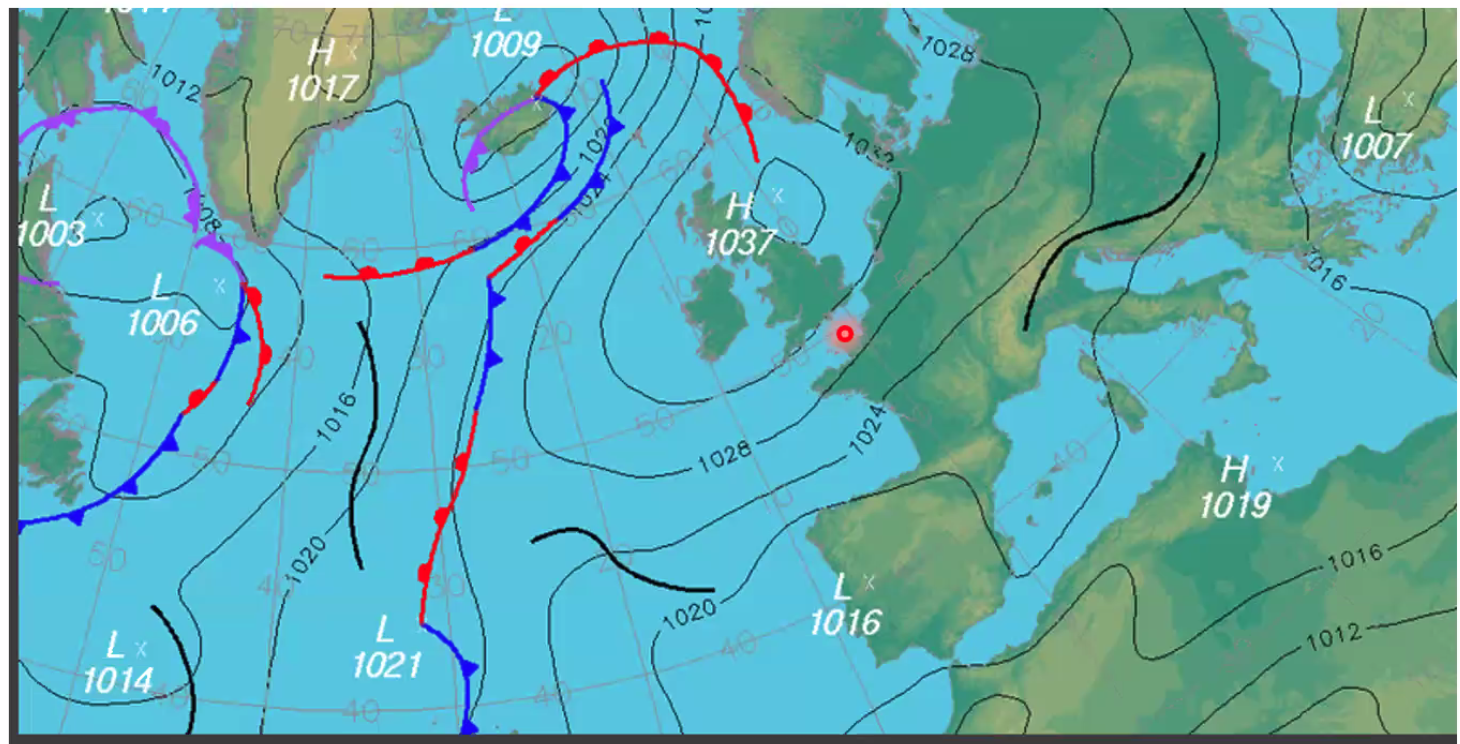
In this example a warm high is blocked over the UK, great for us with nice warm weather. Terrible for Iceland where they will be stuck with a low pressure system.
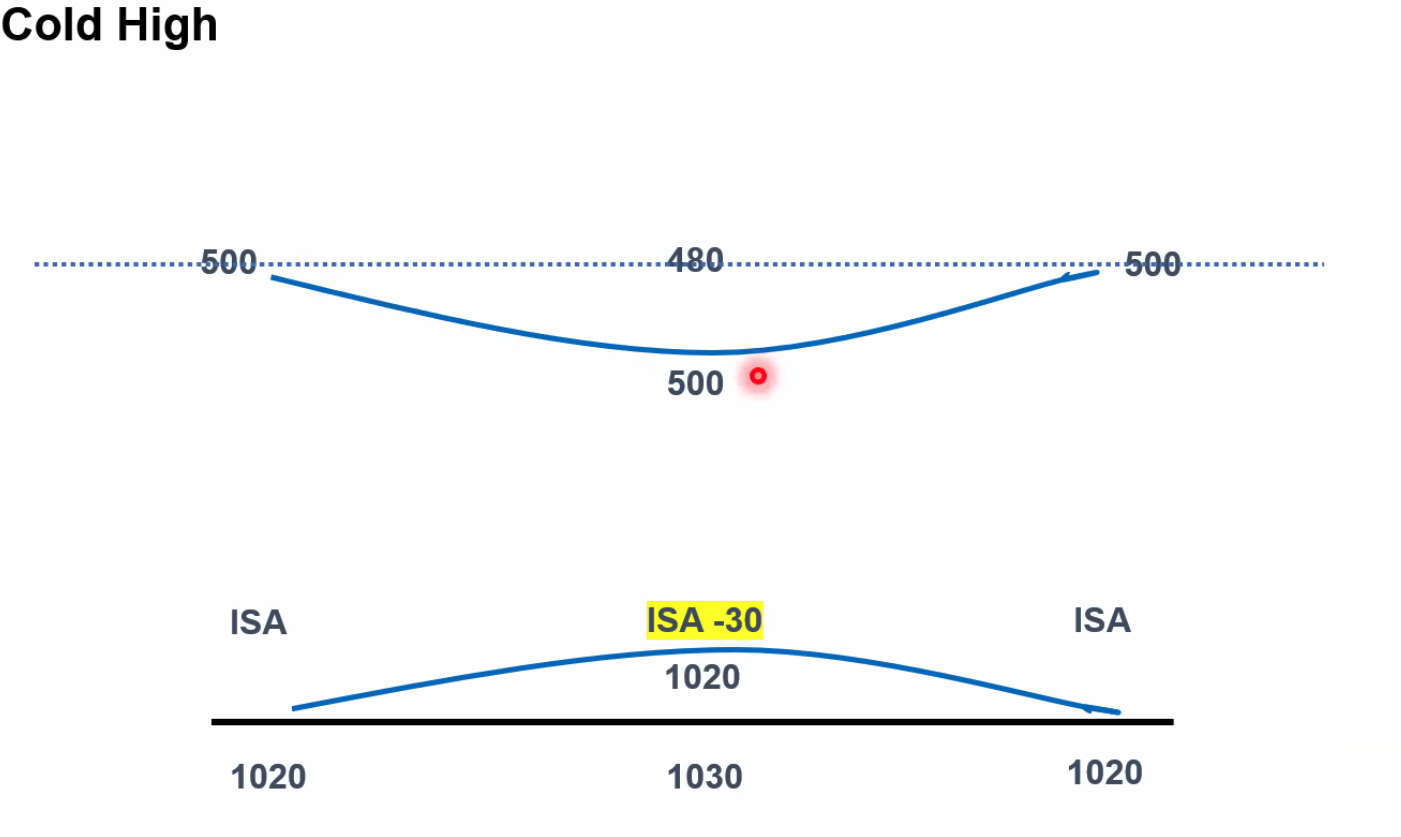 Cold high and cold pool, low pressure aloft. Wind reverses, high laprse rate when the sun returns
Cold High - Cold Pool (aka Cold air drop) Cold anticyclones are formed when cold surface temperatures make the lower troposphere cold and dense. Cold air pools are more prevalent over land than sea.
Greatest activity / instability occurs when there is a greater temperature contrast between cold air at mid and upper levels and the air at the surface.
 Surface heating is greatest at about 2pm local time
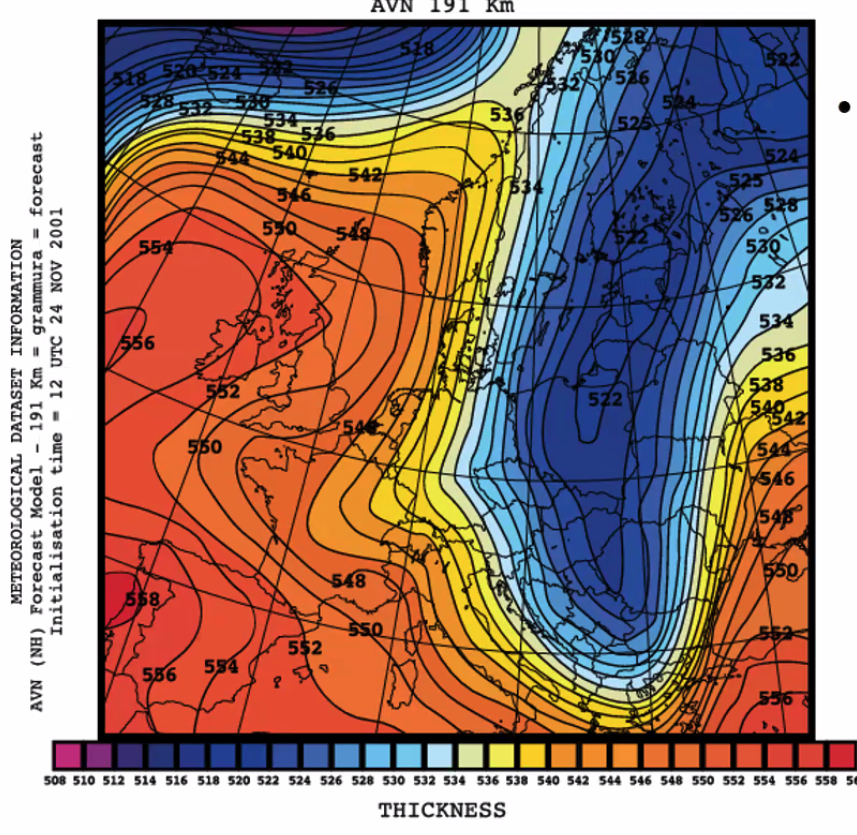
Cold air pool would be indicated by the low contour height on the 500hPa chart and higher
==Q. Which diagram best depicts an atmopshere with HIGH pressure at MSL and Low Pressure at Higher Altitude?==
A.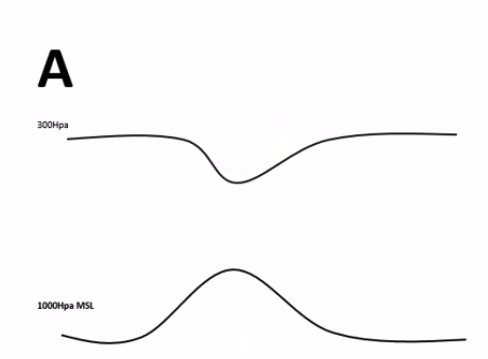
==Q. A cold air pool can be best identified by means of:== A. The isohypses on an upper air chart
Ridges, Troughs and Cols
A ridge:
- Elongated area of relative high pressure, characterised by a generally anticyclonic type of weather
- it may be an extension of a high pressure area
A Trough:
- Normally elongated feature of low atmosphere pressure on a chart
- Highlighted by thick black lines
- Often coincide with fronts across which wind direction and isobar alignment can change.
- Not always associated with unsettled weather, but often are.
- Often produce lines of convective cloud and thunderstorms in conditionally or absolutely unstable air mass
A Col:
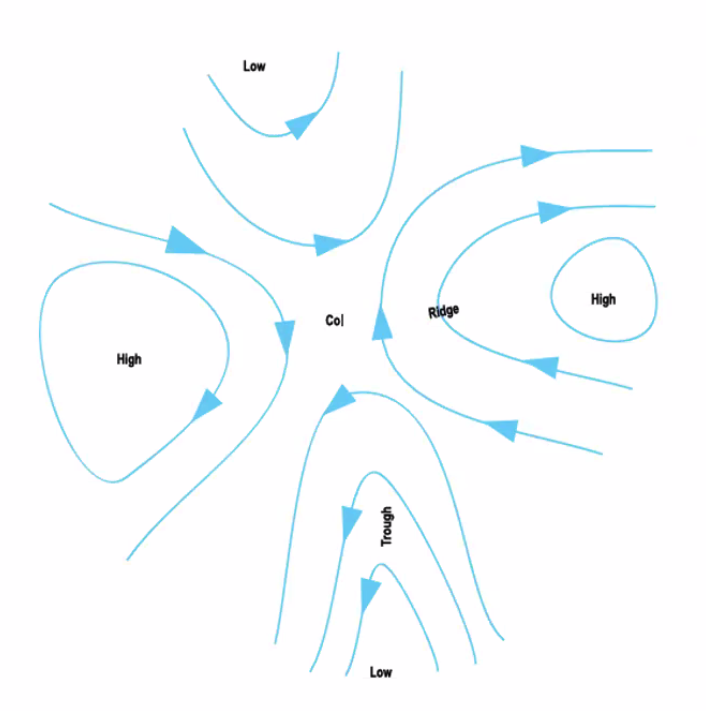
- a region between two highs and two lows
- Flat, not moving much air, with virtually no low level wind
- over sea, which has a stable surface temperature, and over land in winter. Cols show anticyclonic type weather - light winds, clear skies and an inversion at low level
- In winter can also produce deteriorating visibility due to radiation fog
- In summer - can produce isolated thunderstorms and CBs
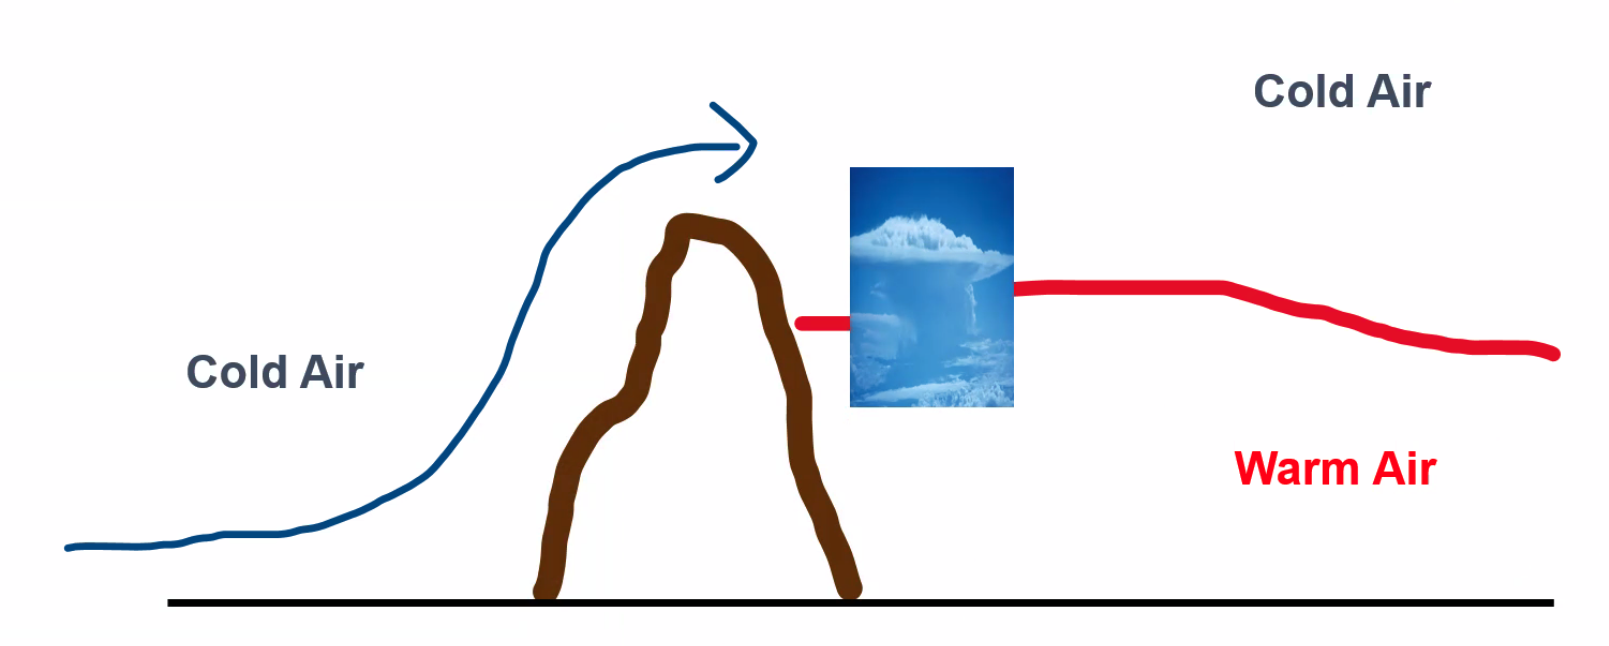
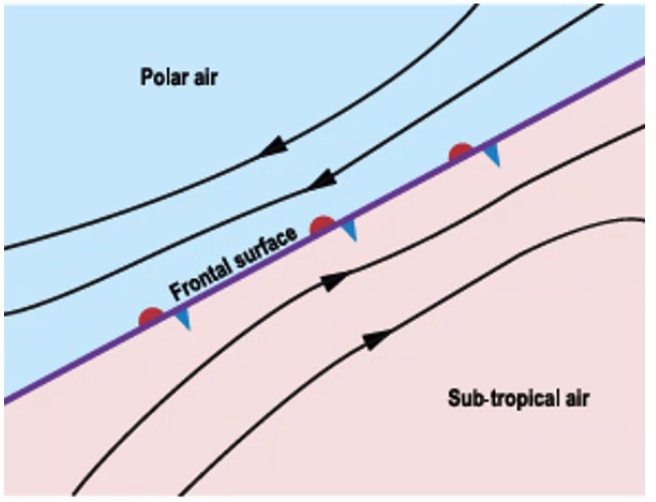
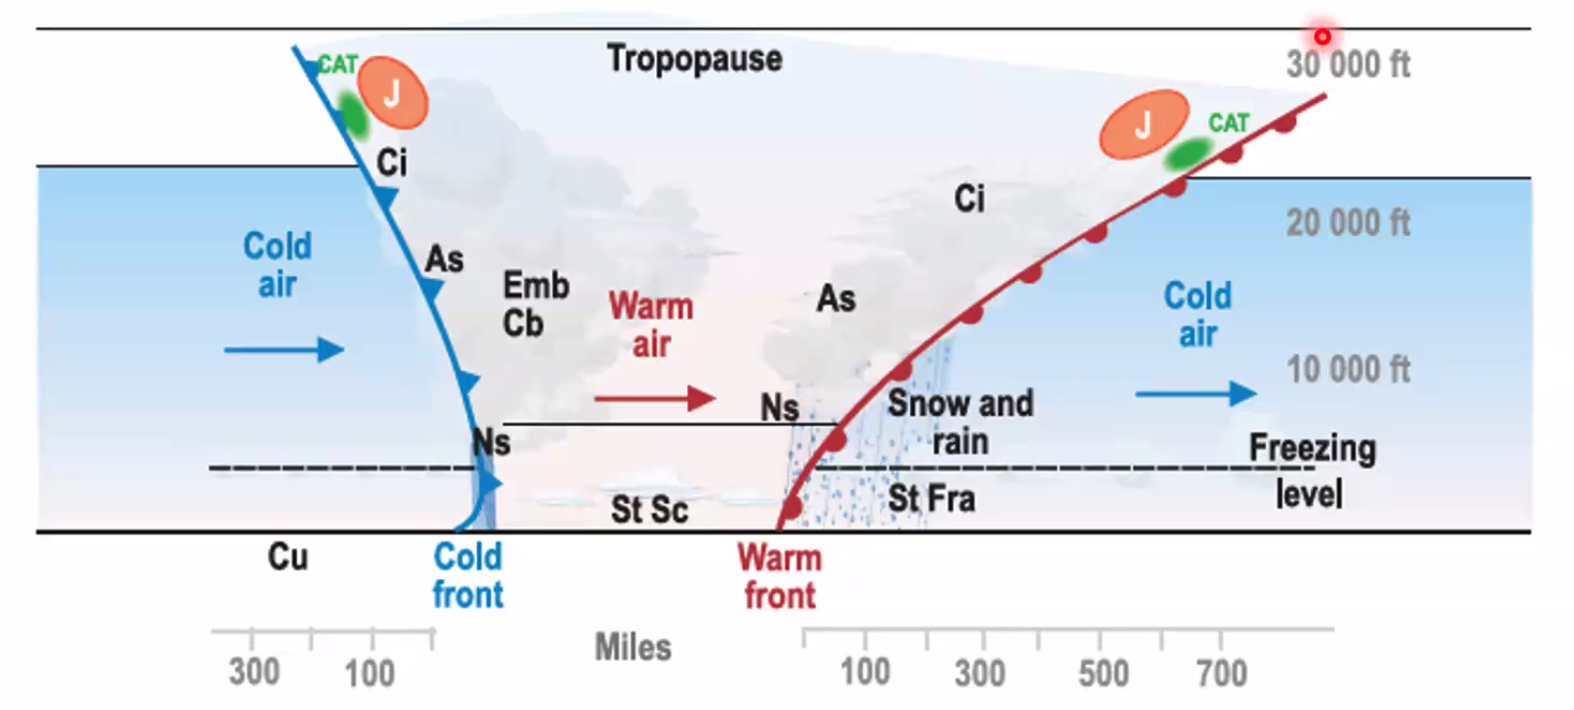
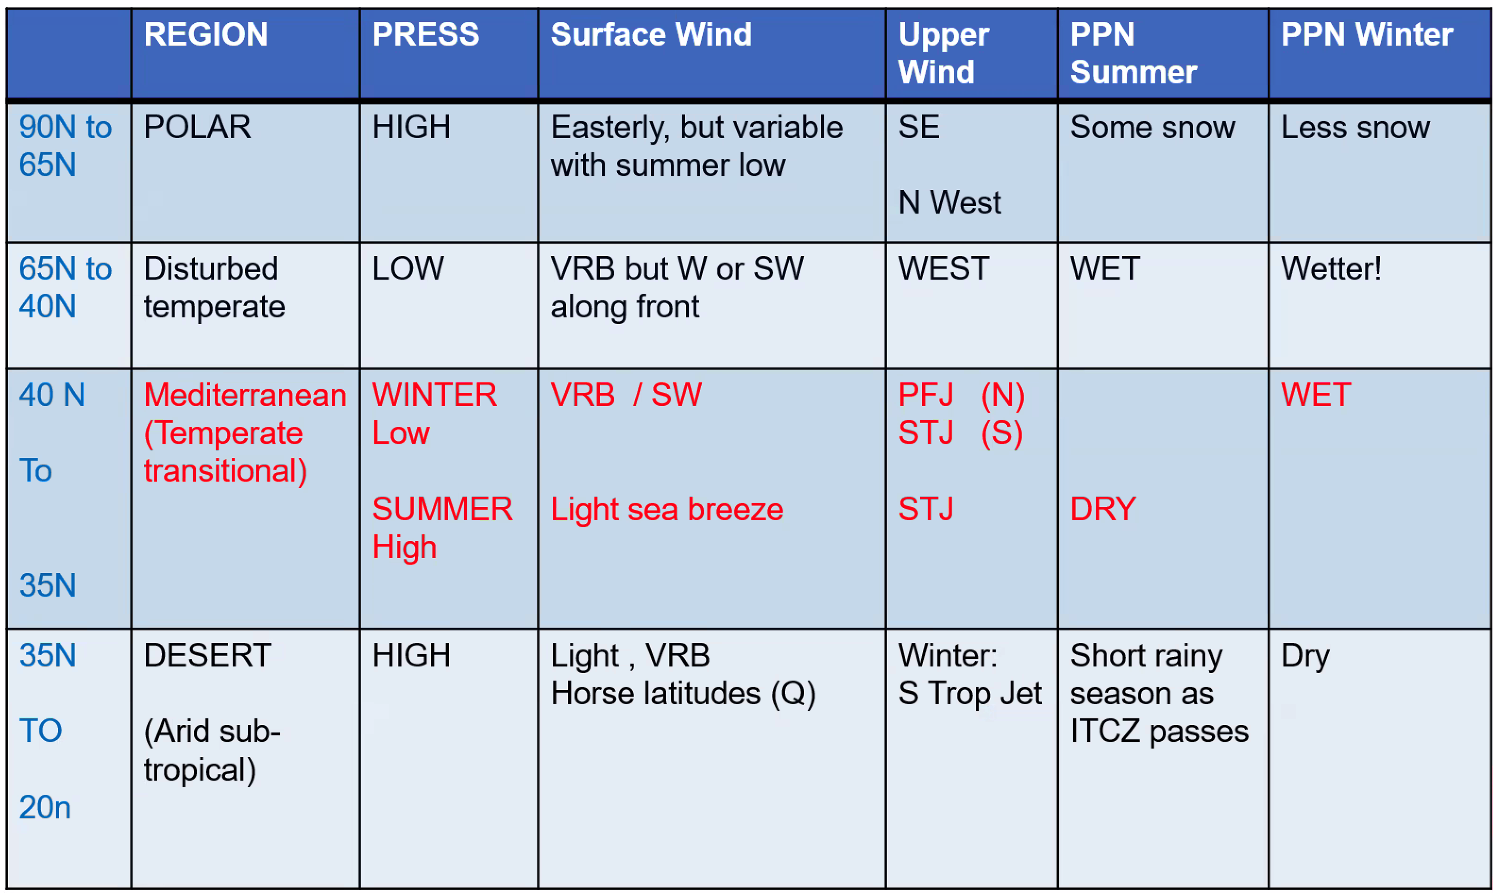
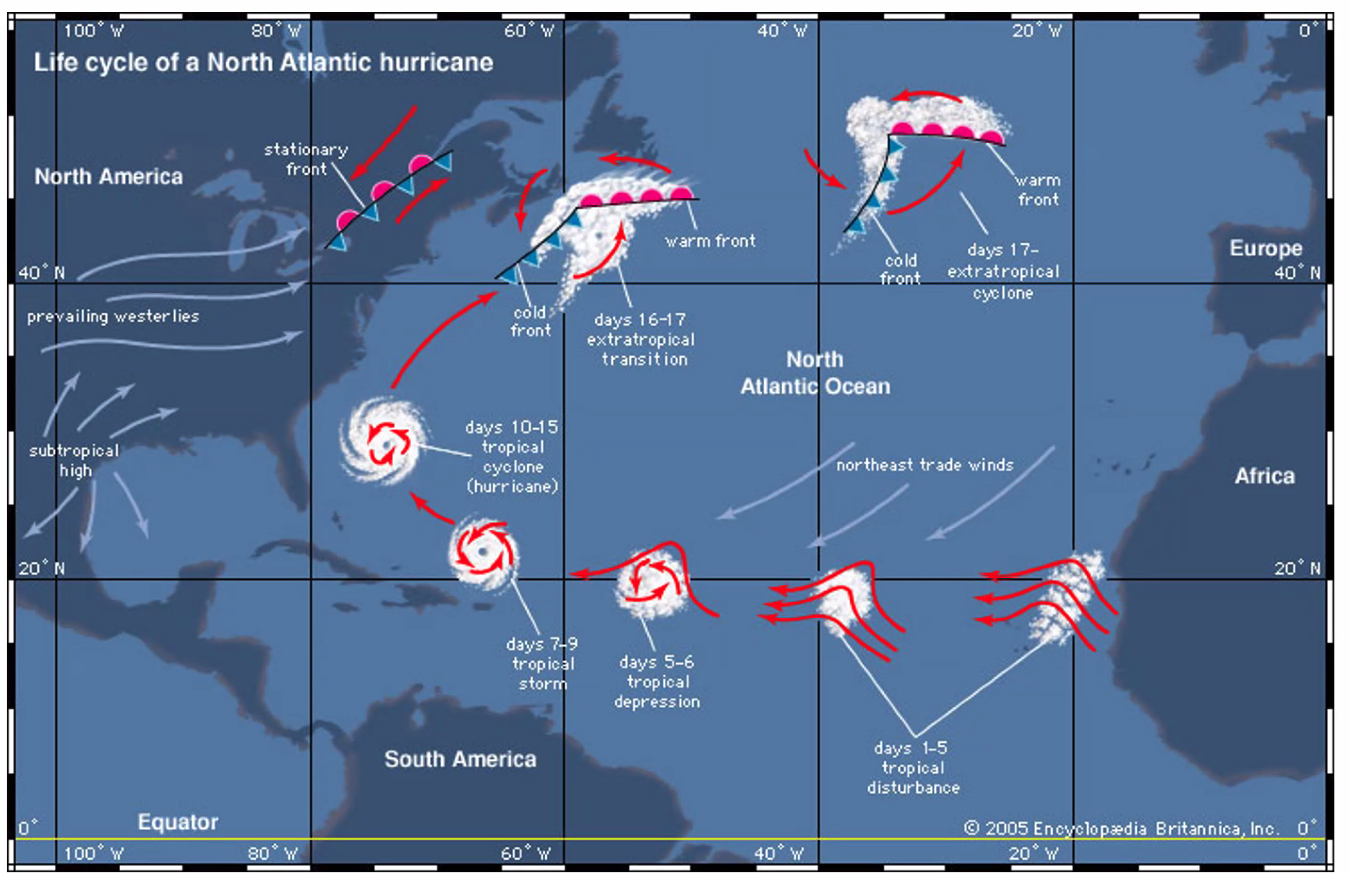
Polar Front Depressions
40-60N/S
- In the northern hemisphere, the winds converging on the equator will be from the NE
- The winds flowing poleward out of the subtropical highs will be from the SW at about 40N
- Between 40-60 is an area of disturbed flow, with low pressure areas constantly forming, moving east and filling, and with the polar front constantly changing its position.
- Travelling lows
- the lows move West to East and are known as Westerly Waves
- In Winter along a mean line from Florida to Brittany, and in summer from Nova Scotia to the Scottish Islands
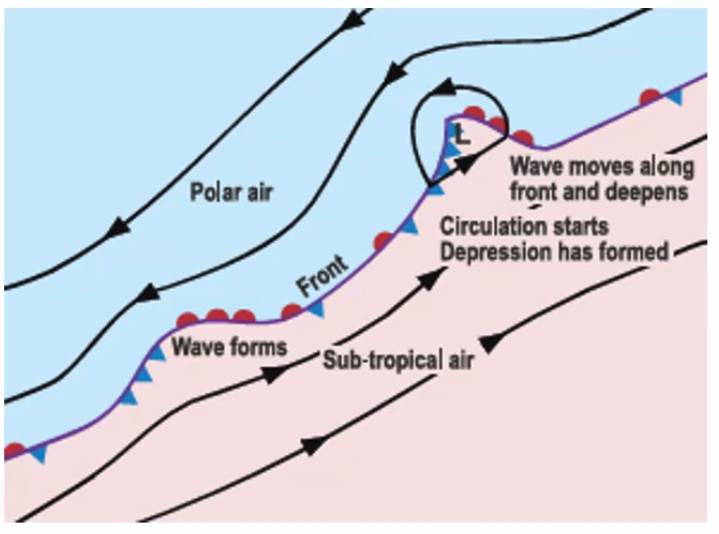
Formation:
Is an unstable situation.
At regular intervals the front wobbles and forms a wave. If the length of these waves is between 500km and 1600km along the front they will continue to deepen and a depression will form. This is because the intruding warm air sector in the wave replaces cold dense air with less dense warm air aloft, reducing the surface pressure. As warm air is carried aloft it becomes self-sustaining, increasing the circulating wind speed and lowers the pressure at the centre and increases the convergence.
Weather associated with a Polar Depression:
What causes the initial formation though? Is it warm air breaking up into the cold air? or the cold air breaking down into the warm air?
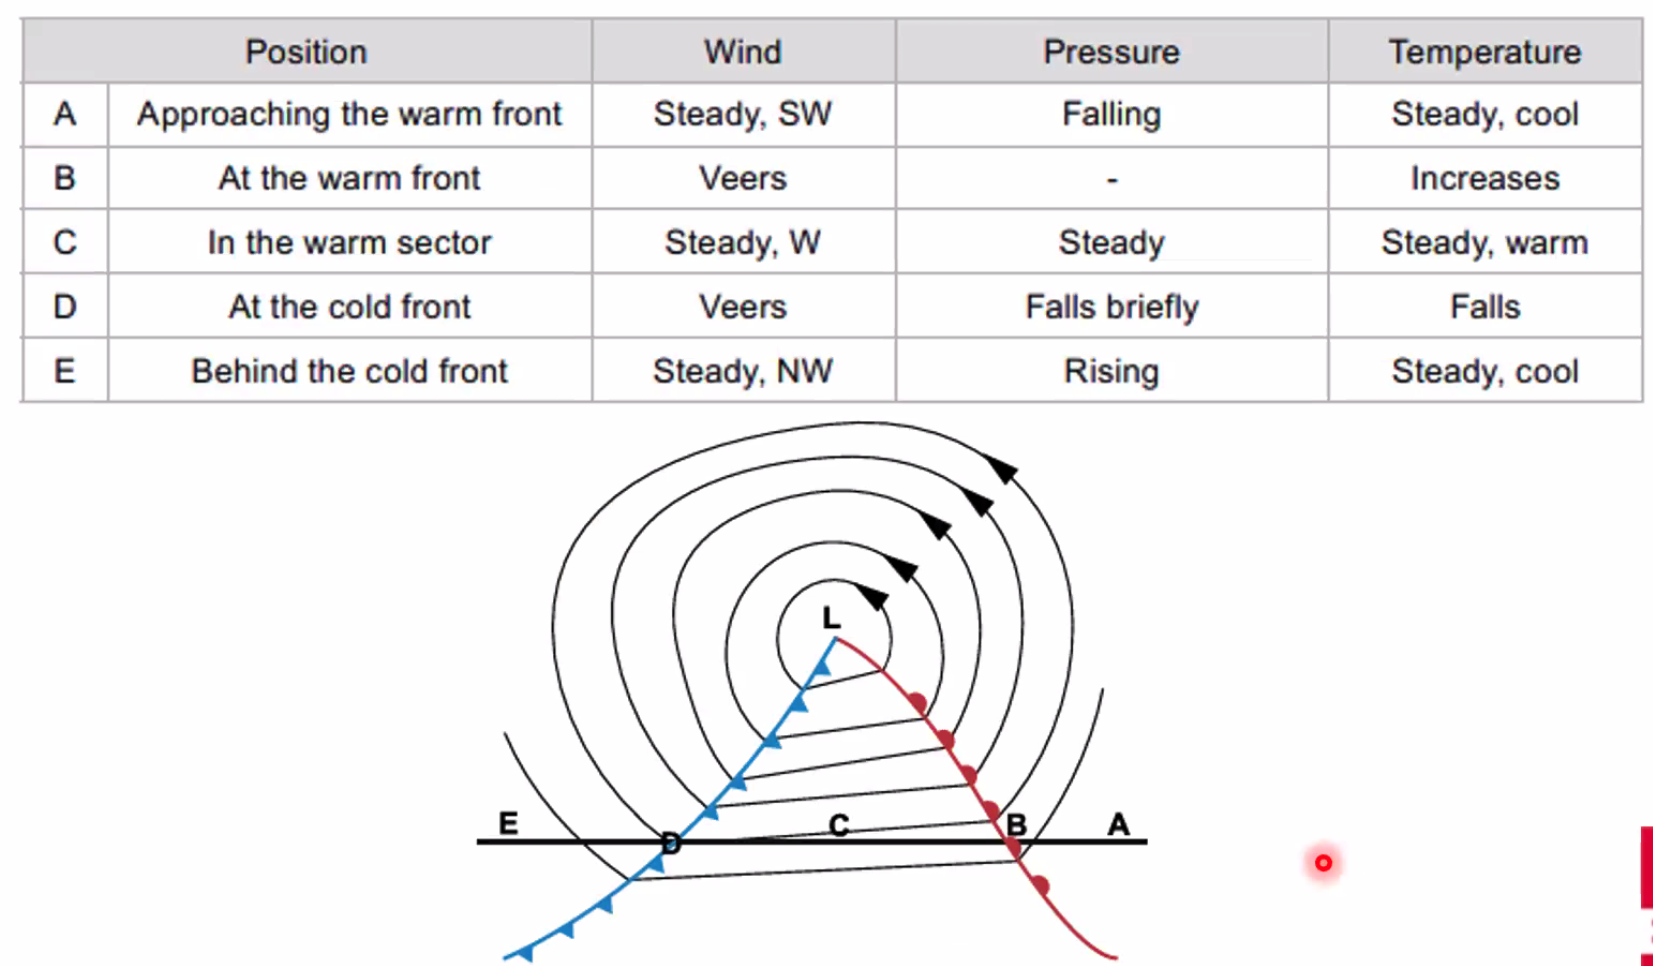
Cross section of a typical open depression
Movement of the depression
- Moves in the direction of the nearest isobars to the center of the warm sector
- the speed is about 80% of the full geostrophic value measured across the nearest pair of isobars to the centre
- As the depression occludes it slows and curves towards the pole
==Q. What change in pressure will occur at point A during the next hour?== A. A drop in pressure
Movement of the fronts
- each section of the front moves at right angles to the frontal surface. But on curved fronts they are moving in different directions
- warm fronts and warm occlusions move slower, typically 2/3 of the geostrophic component
Occlusions
- As the cold front overtakes the warm front, the two will combine
- Warm air will be pushed aloft and the two cold air masses meet on the surface
- Different tracks of the two cold air masses have changed and one cold air mass will be colder than the over
- The temp change across the occlusion is quite small
- Surface temperatures and precipitation do not give good indications on the occlusion.
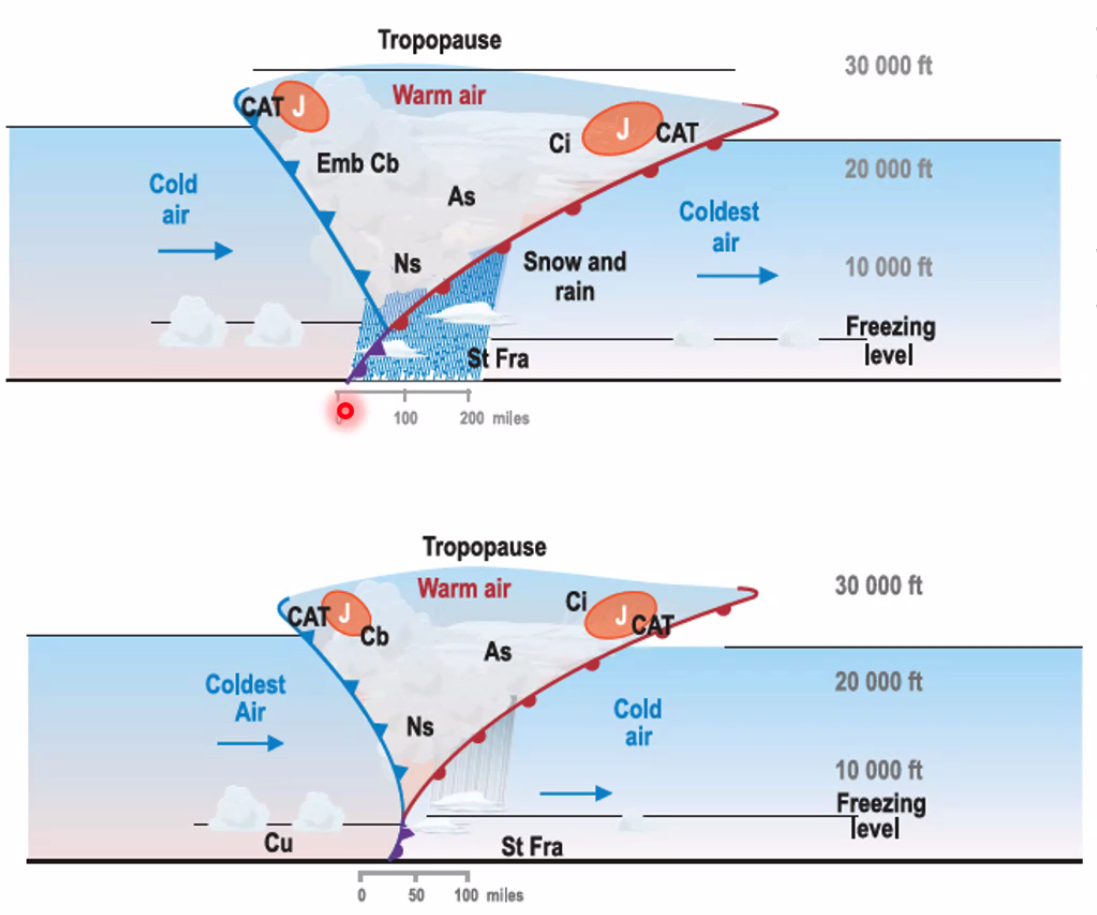
Warm occlusion (upper image) Colder air is in front of the occlusion Cold occlusion (lower image) Colder air is behind the occlusion
Notice the difference in the width of the occlusion between the two.
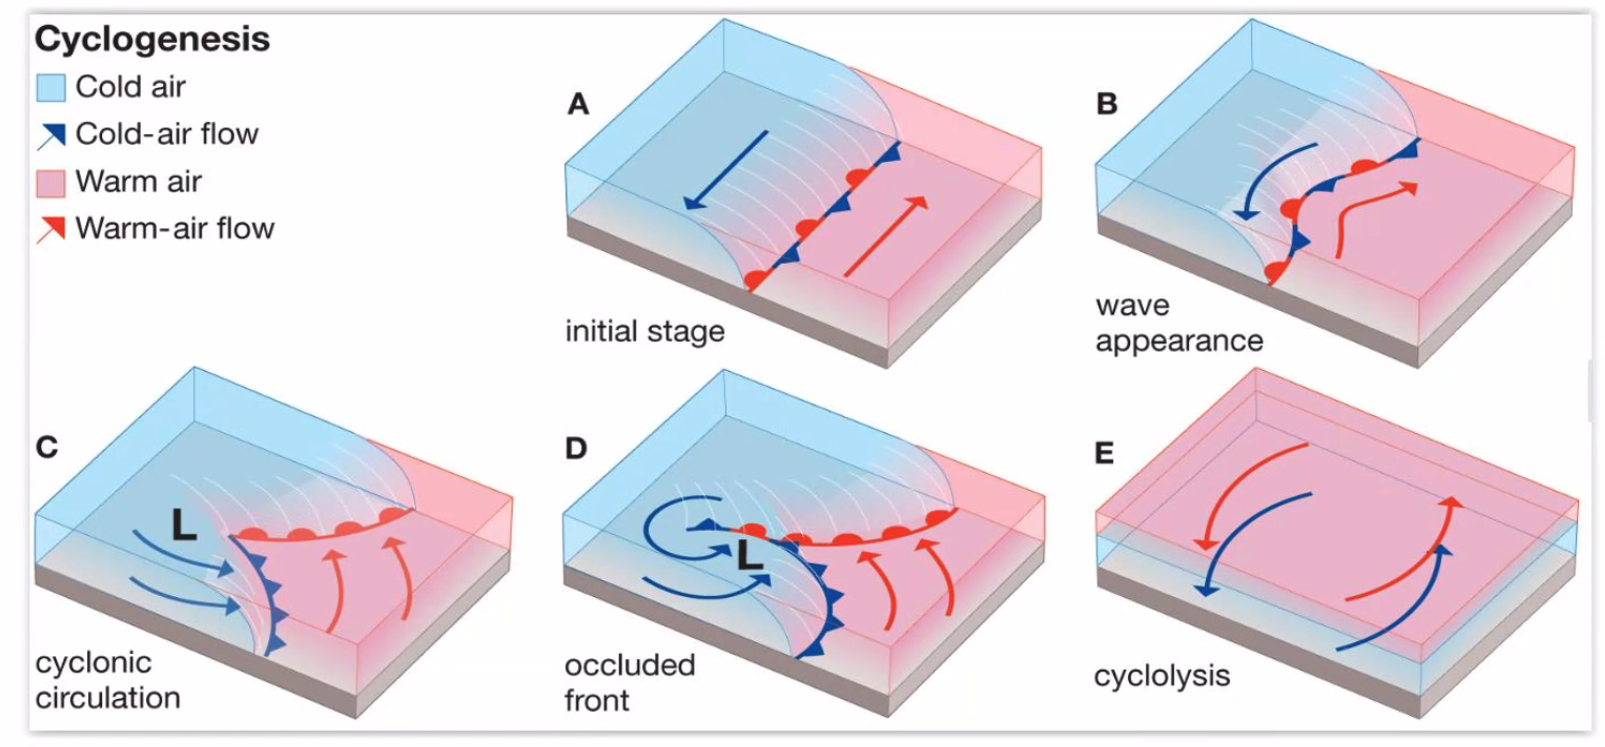
==Q. Which option correctly places, in a chronological order, the four stages of a mid-latitude depression life cycle?== A. Cyclogenesis, developed, occlusion, frontolysis
Secondary Depressions
- wave depressions can grow off the tail ends of primary cold fonts. The secondary depression ORBITS the primary depression in a cyclonic direction (anti-clockwise in NH)
- New centres may develop from the occluded front
- The secondary system can then become the main system, and the primary occluded front becomes caught up in the developing circulation.
Visibility
Definition: Visibility is determined by day with reference to prominent objects at known distances, and by night by observint lights of known intensity.
‘the greatest distance at which a black object of suitable dimensions, situated near the ground can be seen and recognised when observed against a bright background’ AND ‘the greatest distance at which lights in the vicinity of 1000 candelas can be seen and indentified against an unlit background.’
Prevailing visibility - the visibility values that is reached or exceeded within at least half the horizon circle or within at least half of the surface of the aerodrome. These areas could comprise of contiguous or non-contiguous sectors.
meaning that: over half the horizon circle, the prevailing visibility will/might be exceeded.
Prevailing visibility roughly represents the average visibility.
Where the visibility in any direction is either:
- less than the prevailing visibility and less than 1500 meteres or
- less than 50% of the prevailing visibility and less than 5000 metres then the lowest visibility observed will be reported.
When the visibility is fluctuating rapidly, and visibility cannot be determined, only the lowest vis will be reported with no indication of direction. If circling in the area of fluctuating visibility certain sectors could be up to 50% less than that reported.
Prevailing visibility is reported in metres.
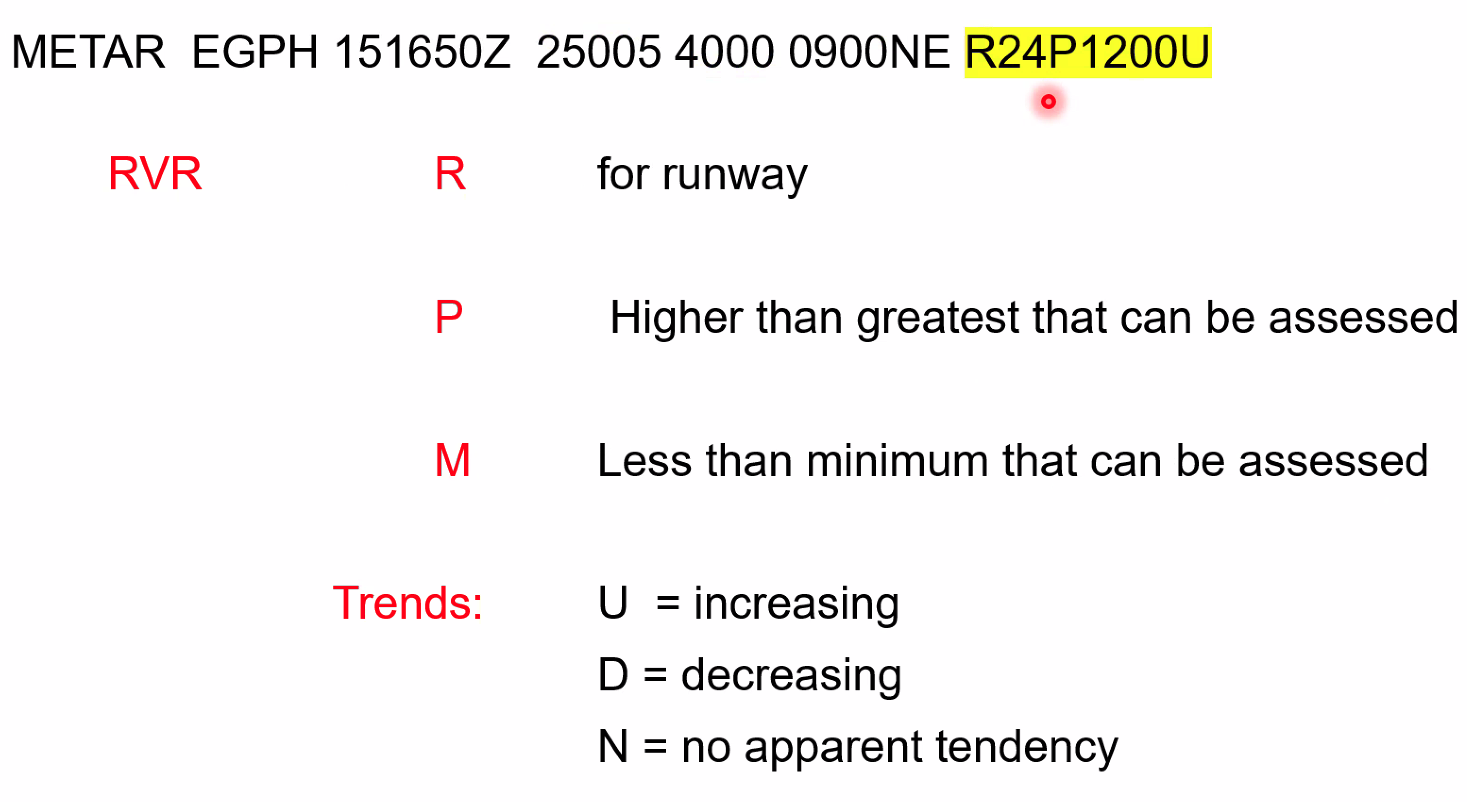
RVR - the range over which the pilot of an aircraft on the centre line of a runway can see the runway surface markings or the lights delineating the runway or indentifying its centre line. It is a horizontal visibility so usually declared in meters
Mostly measured by infra-red or laser sensors - transmissometer or a forward scatter meter. (sometimes a combination of both).
Most systems record three values:
- touchdown point
- midpoint
- stop end value
Should be measured 8-10ft above the runway and at a lateral distance of 120m from the runway centreline.
RVR is reported to pilots in steps of 25m up to 200m, then 50M up to 800 and then up to 100M steps. Probably not reported if 1500M or more. Some values are suppressed if not significant.
RVR is measured in one direction, prevailing vis is the average and the minimum values.
RVR is not a forecast
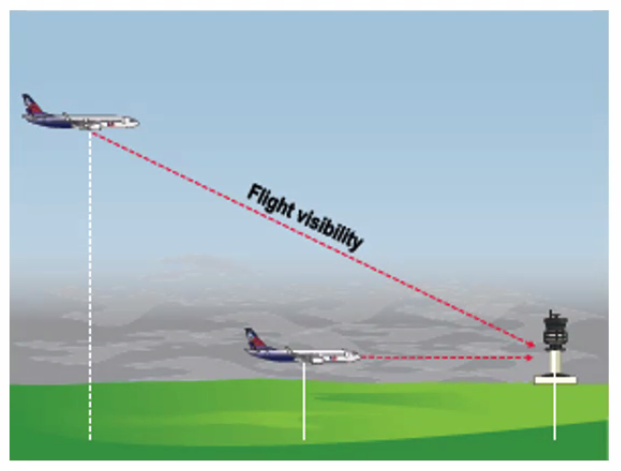
Flight Visibility
- Can be greater than runway visibility, because you can see through a shallow layer of fog from above but not on the ground.
Vertical Visibility
- The maximum height from which a pilot can recognise ground features when the surface is obscured because of a meteorological phenomenon.
- Reported in 15m/50ft intervals up to 90m, and in steps of 30m/100ft between 90m and 600m.
- WMO Aerodrome Reports and Forecast - A users handbook to the code
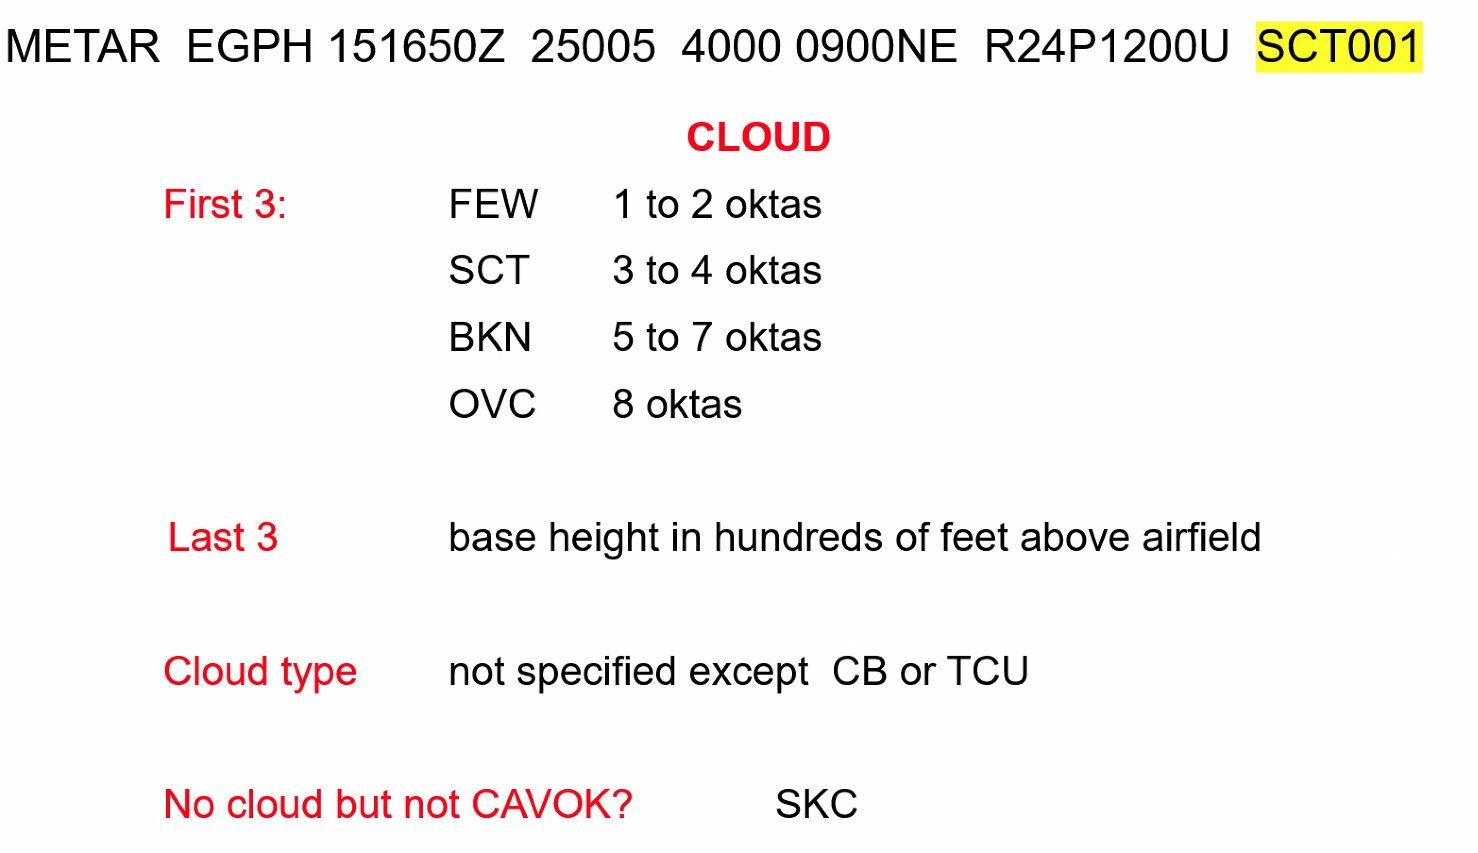
- In a metar represented by VV
- When the sky is obscured and vertical vis cannot be assessed it will read VV///
- VV003 = Vertical Vis 300ft
Poor visibility - causes
Phenomena that reduce visibility:
- Fog
- Mist
- Cloud
- Precipitation
- Sea Spray
- Dust
- Sand
- Smoke
Water based: Mist - visibility from 1000 - 5000 RH at least 95% Fog - visibility less than 1000M, RH near 100% Freezing Fog - Fog with temp reduced below 0C Ice Fog - ice crystals rather than water droplets, occurs at temps below minus 20C
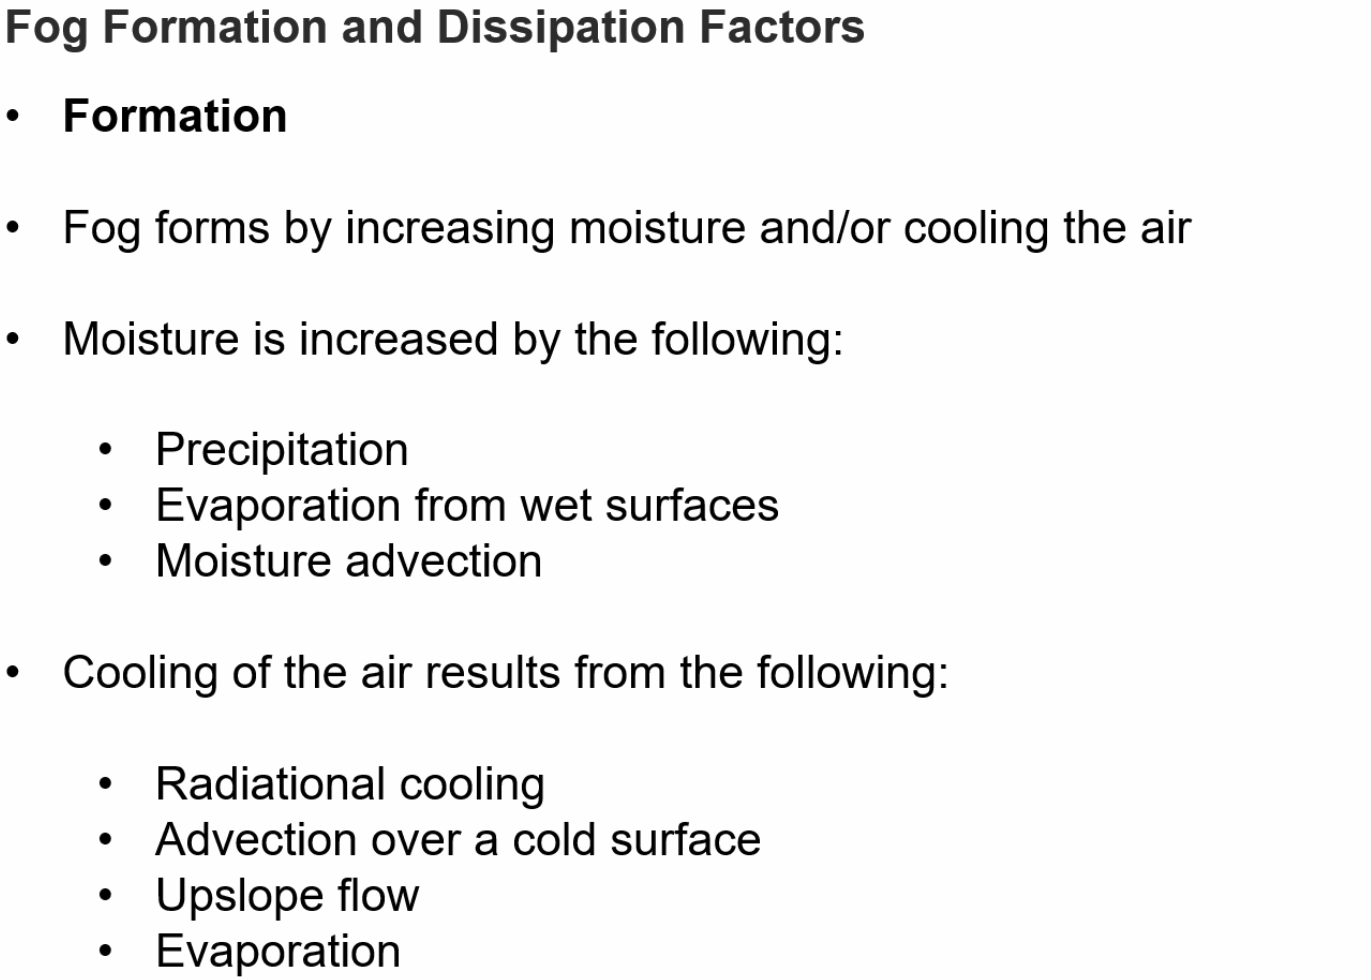
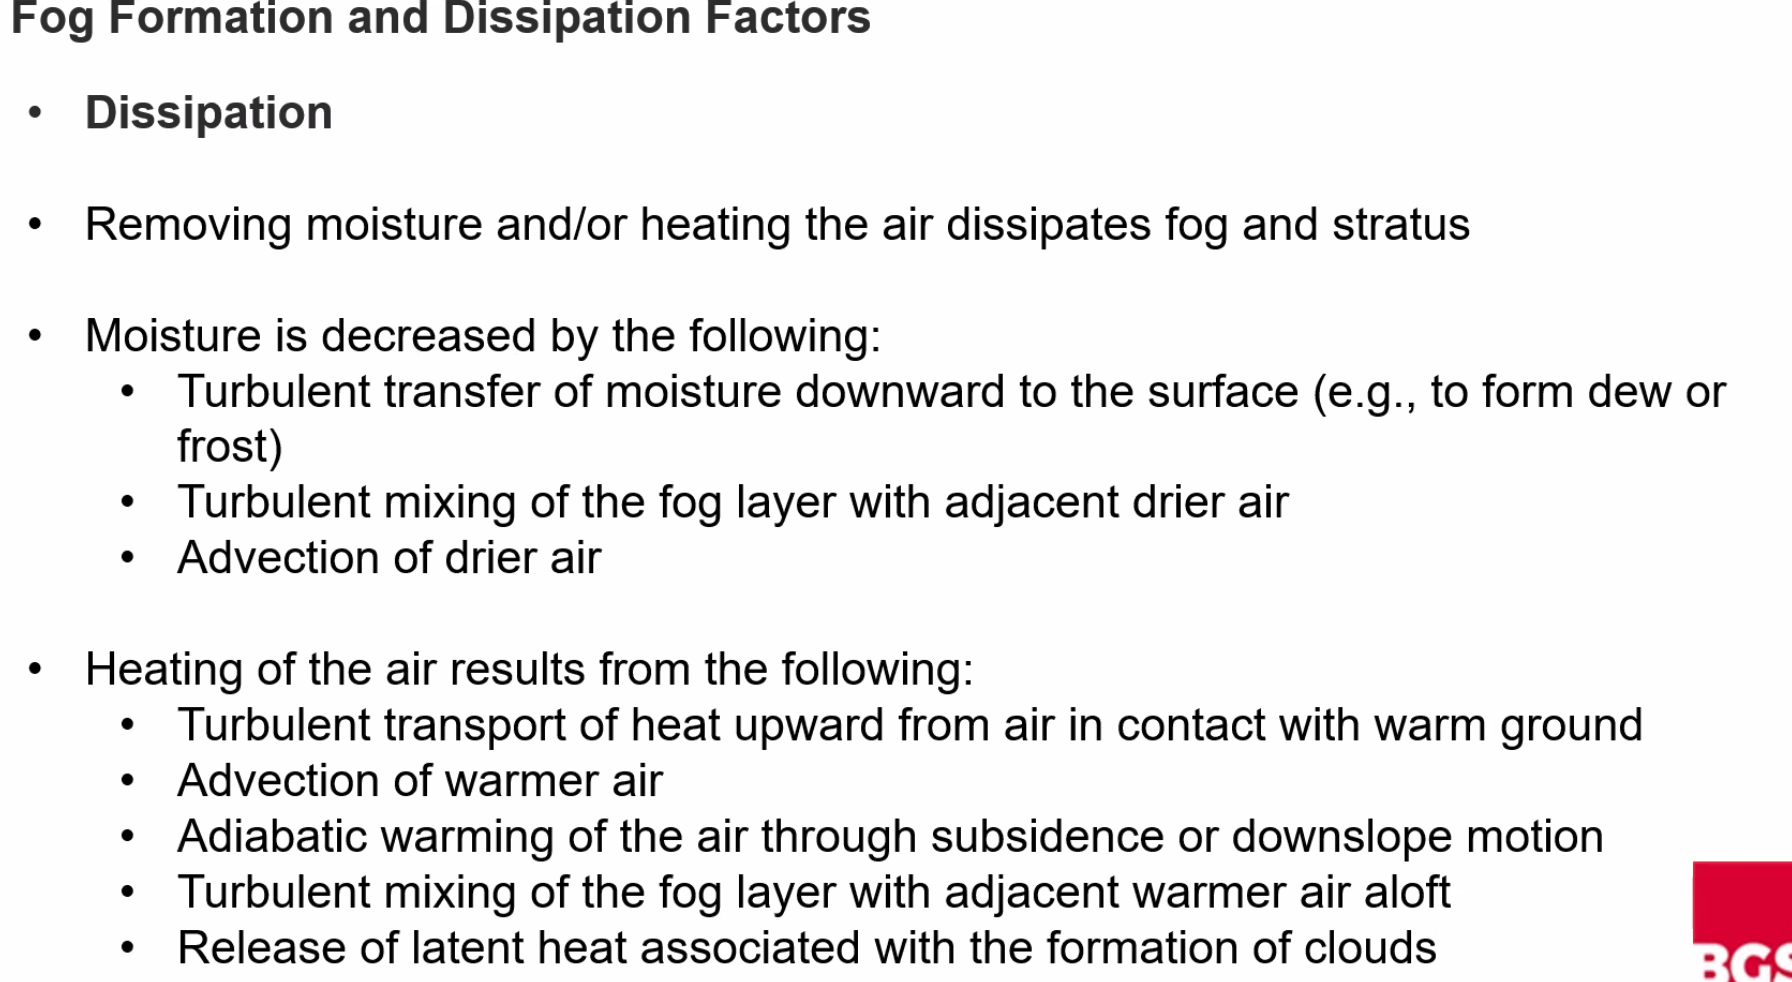
Radiation Fog - formed when the surface cools at night due to loss of heat through long wave radiation. Depth of radiation fog increases through the night, thickest radiation fog is just after sunrise. Cold surface cools the air in contact by conduction, bringing it below its dew point. Only occurs over land, away from the coast when there is little or no cloud cover to limit the temperature fall. Rarely over 500ft thick.
Conditions favouring
- Over land
- At night
- Clear skies
- Light winds (2-8kt)
- High RH
- Hygroscopic Nuclei
- Typically high pressure systems
Industrial contamination increases the likelihood.
Advection Fog - when a warm moist air mass moves over a cold surface. About 15kt wind speed is needed to move the mass. Does not matter where the warm moist air comes from or whether its over land or sea.
Majority of advection fog comes from warm air from the sub-tropical high pressure regions flowing towards the polar front zone and meeting cold ocean currents coming in from the poles.
Orographic / Hill / Upslope Fog (cumulogranitus) - air forced to rise up a hill, cools adiabatically to the dew point, usually on the windward slopes. Dissipates on the leeward descent. Common under Fohn conditions.
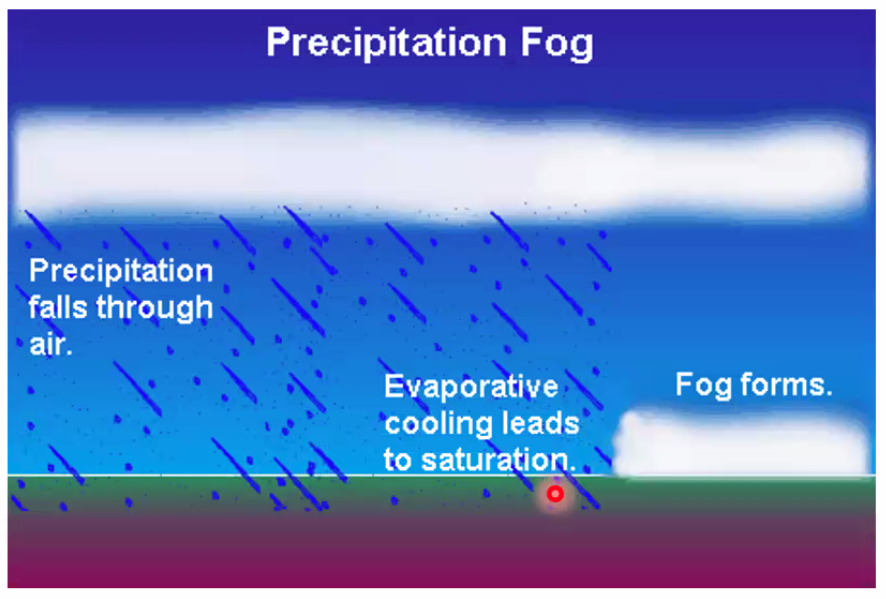
Frontal Fog / Precipitation Fog - associated with a passage of a warm front, and can be hill fog, thaw fog or a type of very low stratus cloud formed in the continuous rain at frontal passage. It disperses with frontal passage (slowly). Can be replaced with advection fog. Can be up to 200 miles deep.
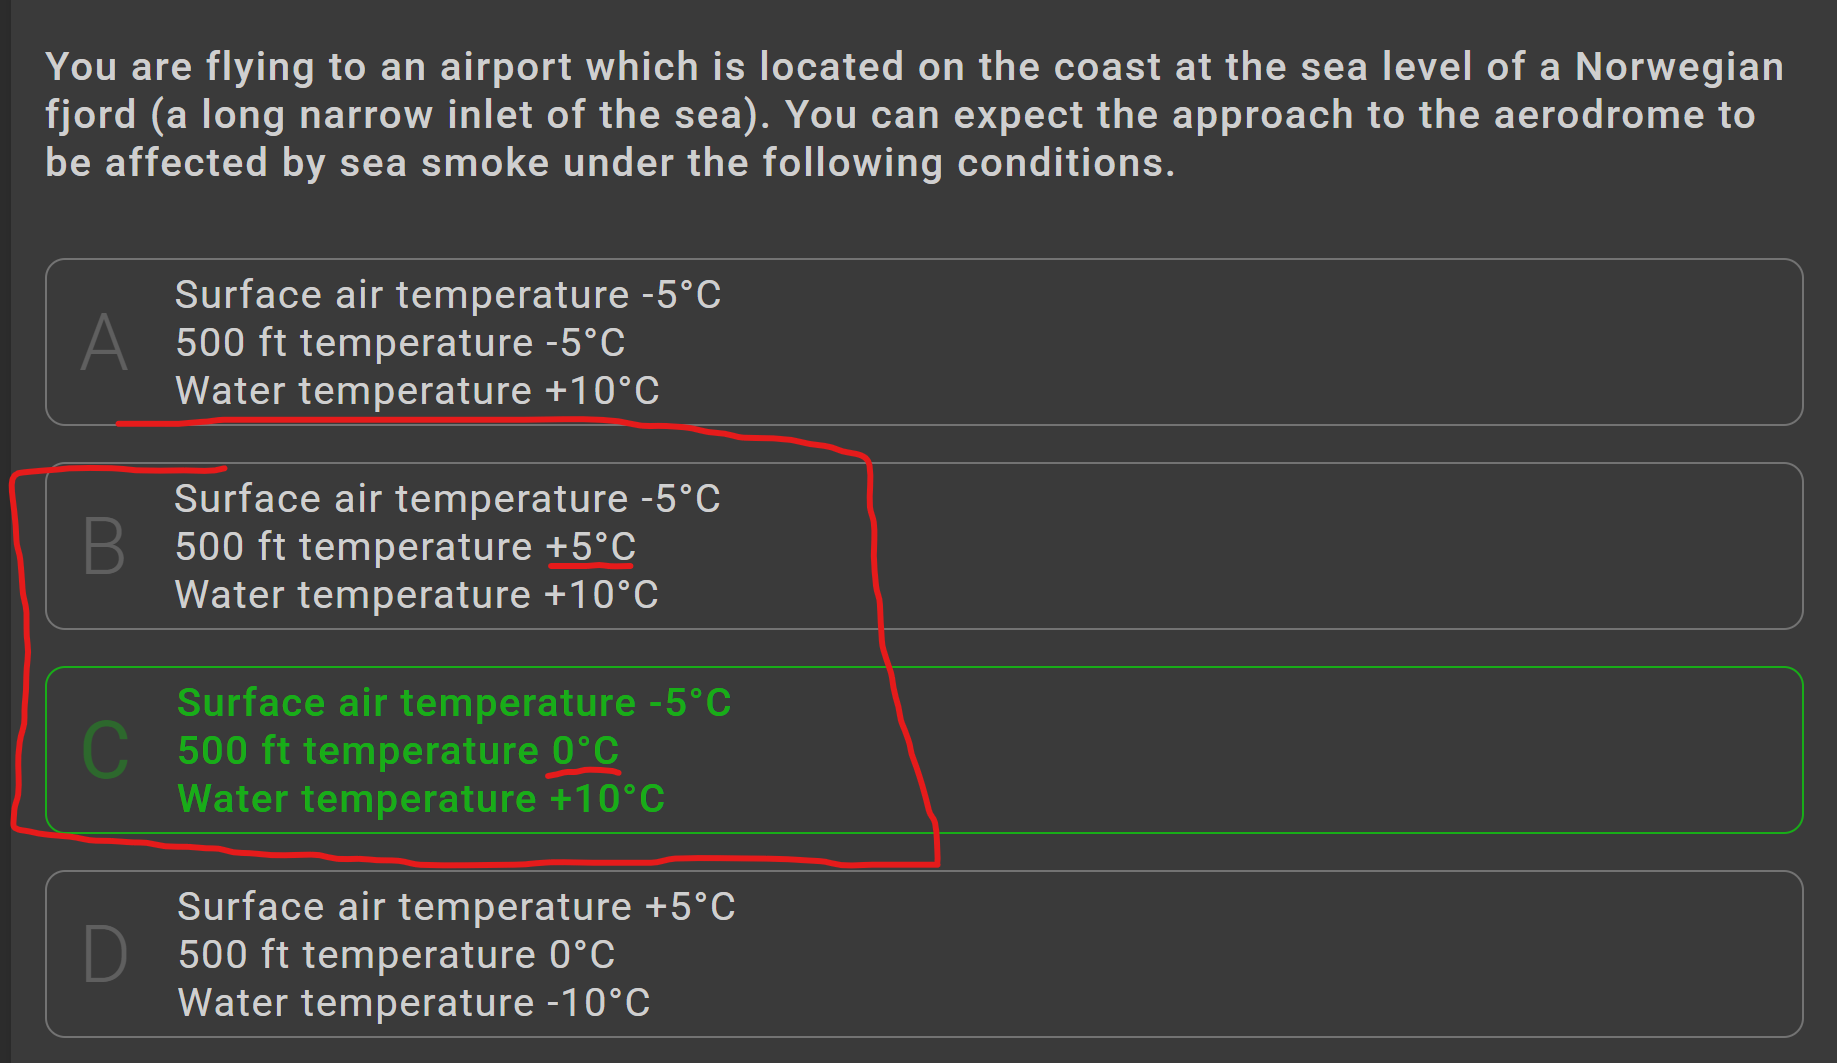
Steam fog / Sea Smoke / Arctic Smoke - Reverse of advection fog, cold air moving over a warm(er) surface. Always appears over water. Normally associated with an inversion. Moisture and heating from below would normally produce instability and convection in the air mass.
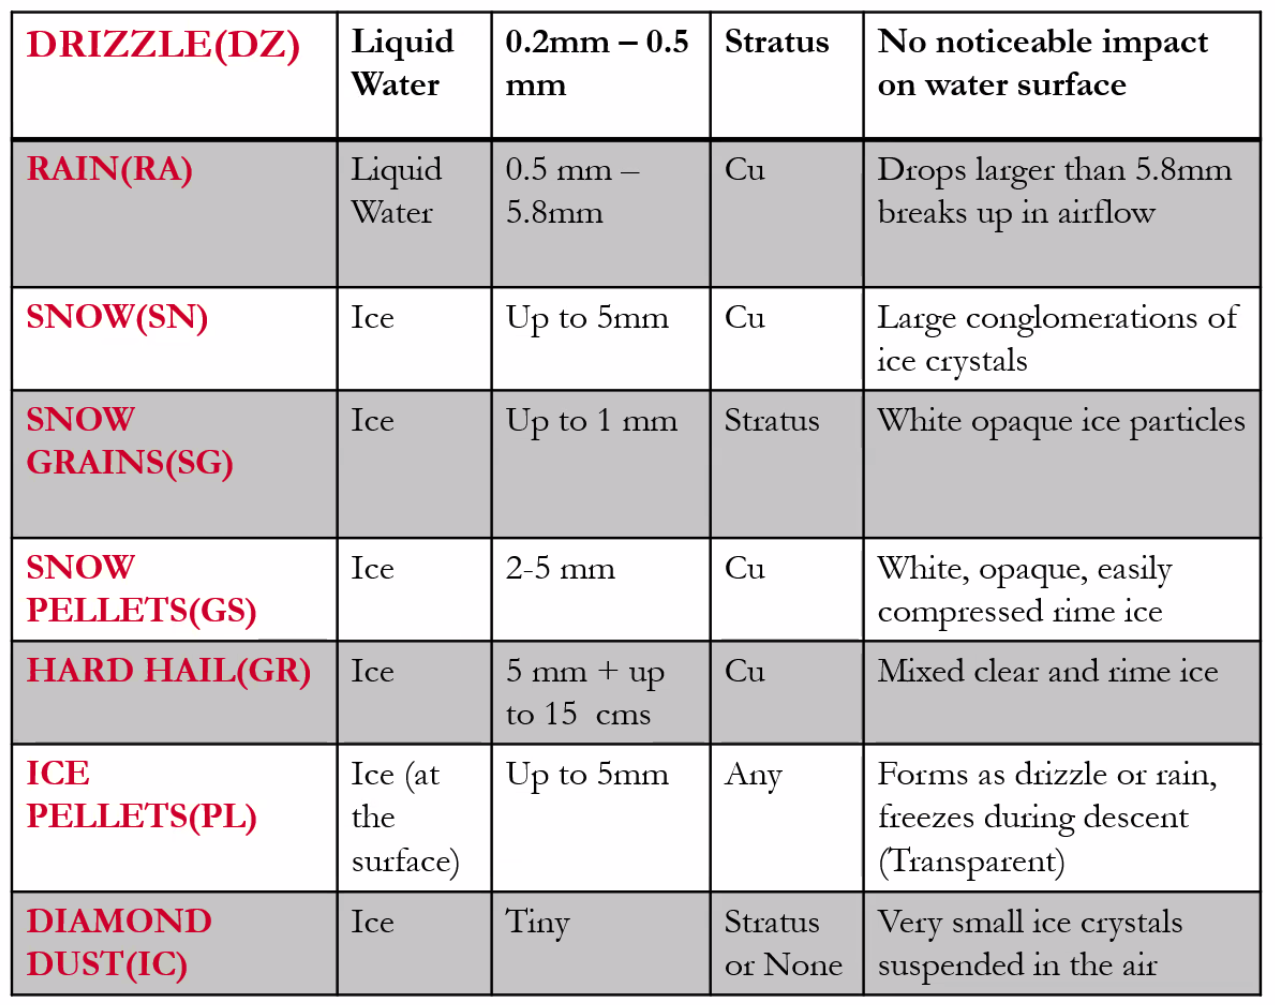
Liquid equivalent snowfall rate - the amount of melted snowfall per unit of time and is typically measured by a snow gauge in mm per hour
the wetness of snow is the amount of liquid content within the falling snow
in dry snow - the temperature is below freezing and so snow will have a low liquid content.
Rimed snow - refers to snowflakes that are partially or completely coated in time frozen water droplets. Produce very heavy, wet snow. Bigger the snowflake, the less dense it is.
Poor visibility - solid based
Haze
- is a reduction in visibility due to solid particles, not water droplets.
- If visibility is reduced below 1000m it will be described as smoke haze or dust haze.
- Inversions can show the pollution haze boundary
Dust and Sandstorms
- Common meteorological hazards in arid and semi-arid regions
- usually caused by thunderstorms or strong pressure gradients
- some 40% of aerosols in the troposphere are dust particles from wind erosion
- Gradient wind sandstorm is caused by strong low-level winds lifting sand into the boundary layer. Widespread but usually only as deep as the boundary layer
- Haboob associated with the gust front from thunderstorms blowing over a dry desert or extensive convection of dry air.
- Can be very dense, and extend up to 6000ft or more. Usually localised and narrow
- Can reach up to 15000ft
- +DS on METAR if visibility is below 500M.
Volcanic Ash
- Visibility
- flying into rising or setting sun
- reflection off haze or fog
- affect depth perception
- high altitude glare
- Engine Damage
- Flameout
- Pilot Reports - required of volcanic ash seen or encountered, and any pre-eruption activity
- Volcanic Ash advisoty centres are established to monitor and advise of the progress of volcanic ash clouds
- plan language format in reports
Clouds and Precipitation
Four types of lifting
- Convection
- Orographic
- Frontal
- Turbulence
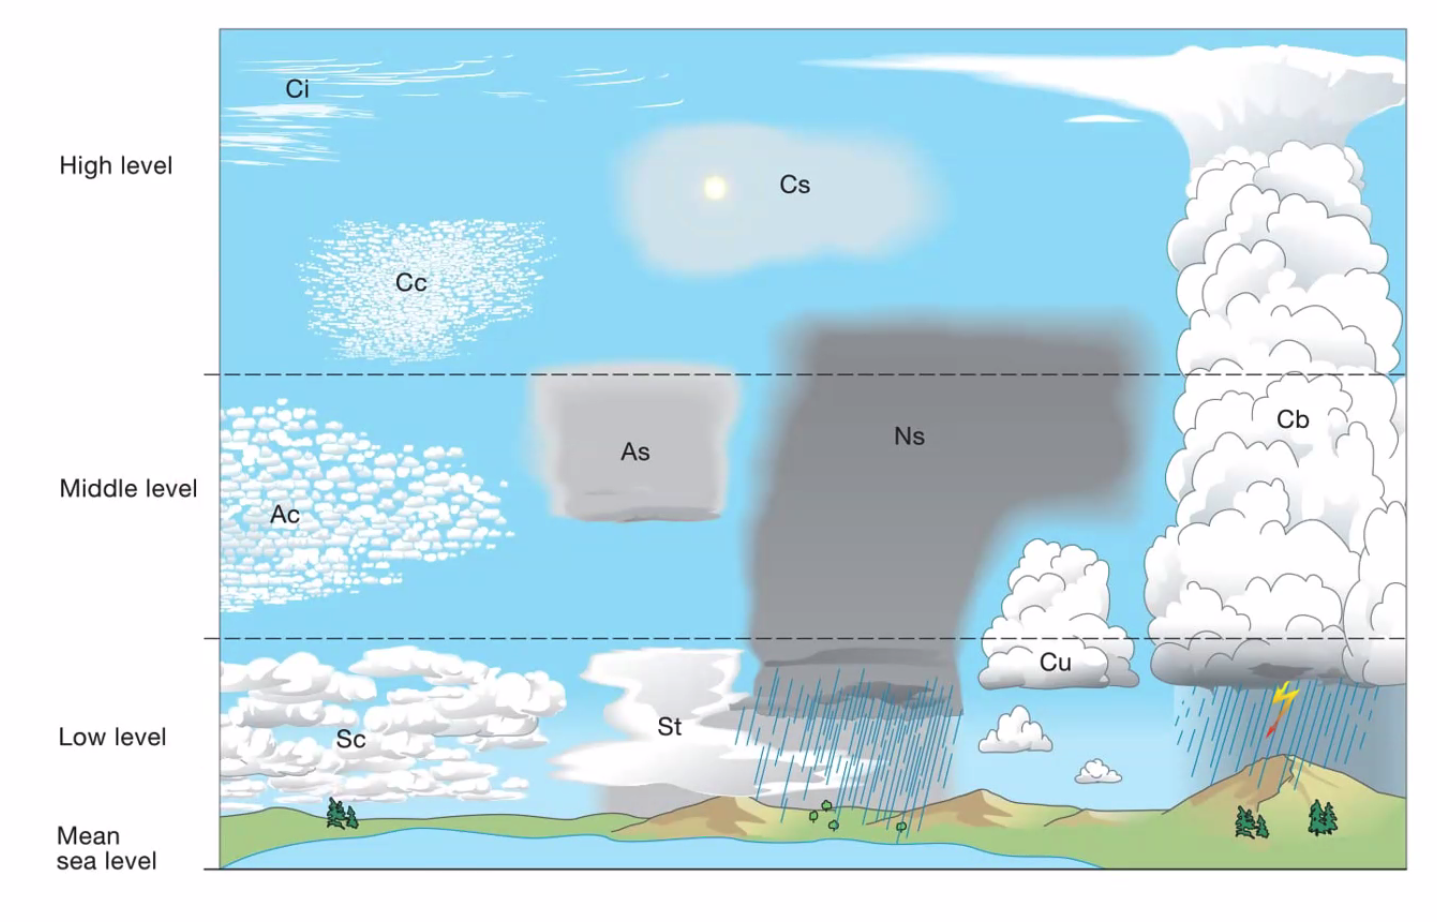
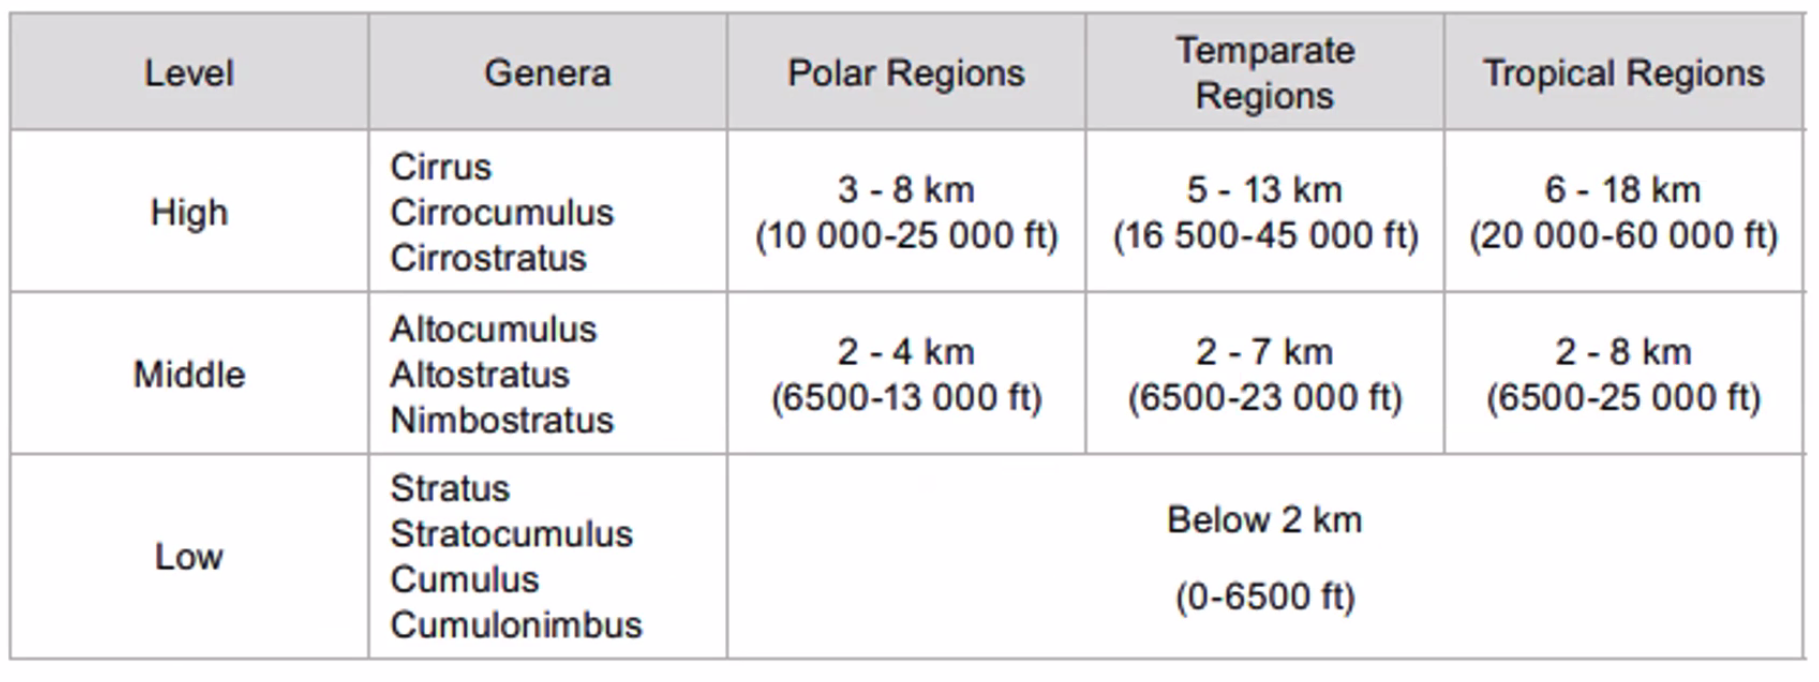
Height of these levels depends on what latitude you are at.
Top of middle level is variable (with lat) - Over Europe 16,500ft, over the US can be up to 20,000ft.
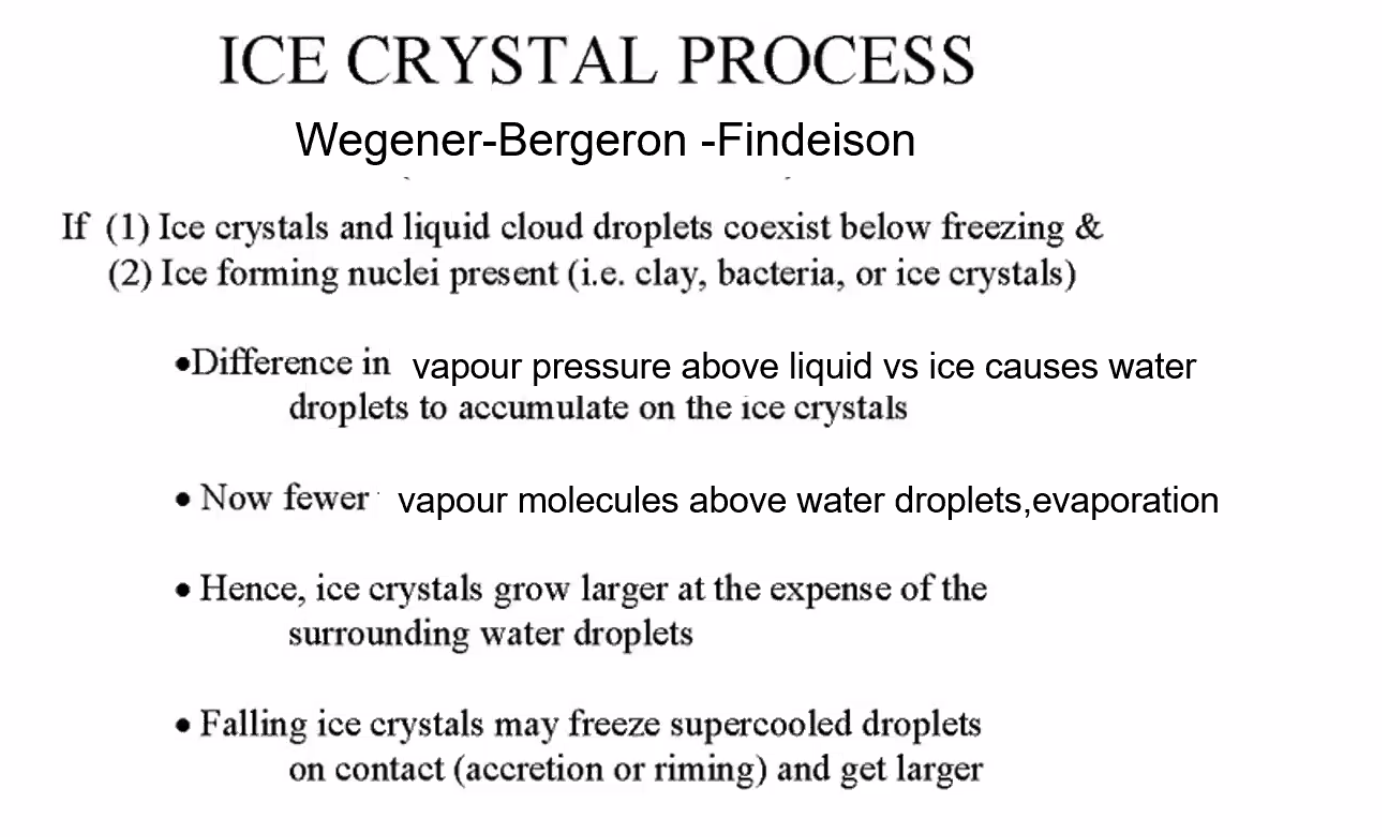
Precipitation Theory:
- Ice Crystal Process (Wegener-Bergeron-Findeison)
- Coalescence - collide with others to grow
Thunderstorms
Requires
- moisture
- instability (10000ft)
- trigger
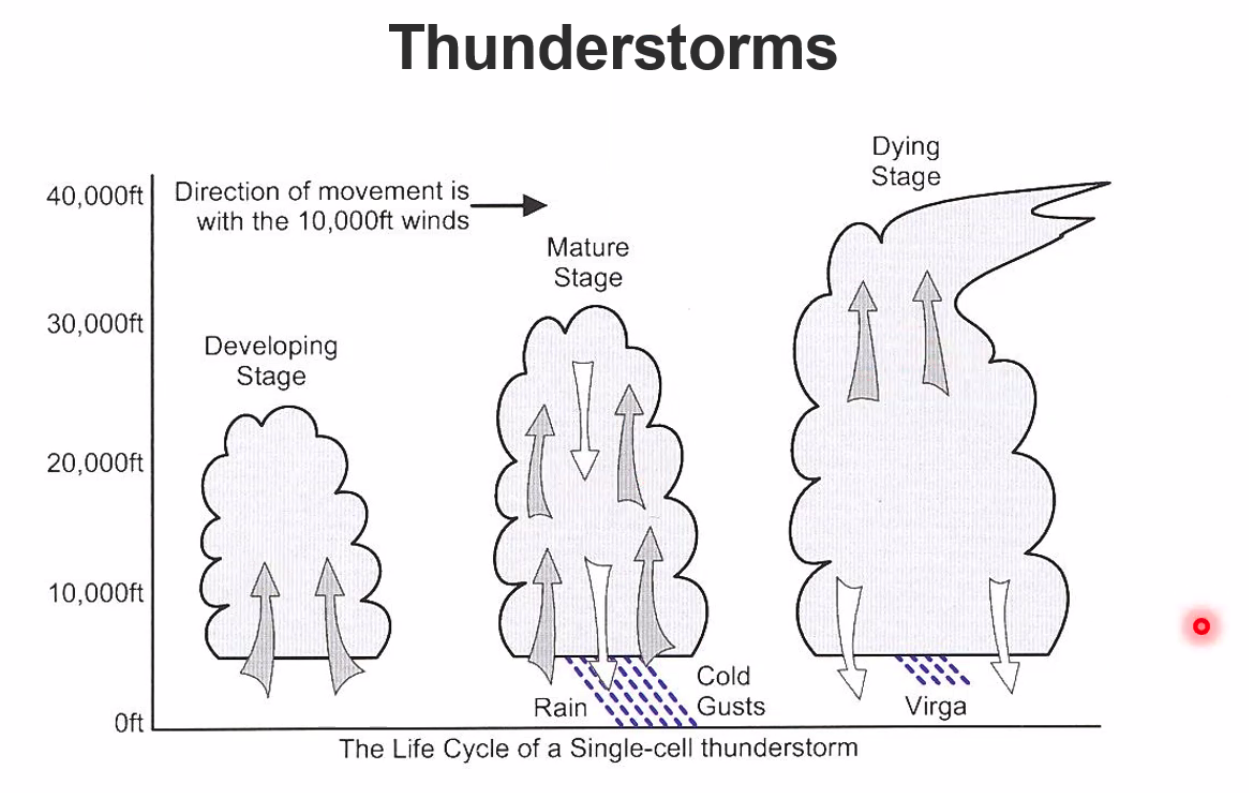
Developing stage - only updrafts, can be up to 50kts vertical speed. No rain, 15-20 mins. Mature Stage - updrafts and downdrafts, producing moderate to severe turbulence. Water drops start to fall in the cloud. Updrafts can be up to 10,000ft/m. Tends to move with the 10,000ft wind. Fastest moving Mature TS is in cold fronts. 30-40 mins Dying stage - Rising air mixes with upper air to prevent instability, can take up to an hour in the dying stage.
Gust front - can be up to 24-32kms ahead, up to 6000ft depth. Avoid by 10miles, 5000ft vertically. Assume severe icing.
Wet Microburst - where the rain touches the ground Dry Microburst - where the rain is evaporated before it touches the ground, normally stronger than a Wet Microburst, Virga - where rain is evaporated before it touches the ground.
Microbursts 4-5km, lasts 5-30mins.
80kts of airspeed can be lost.
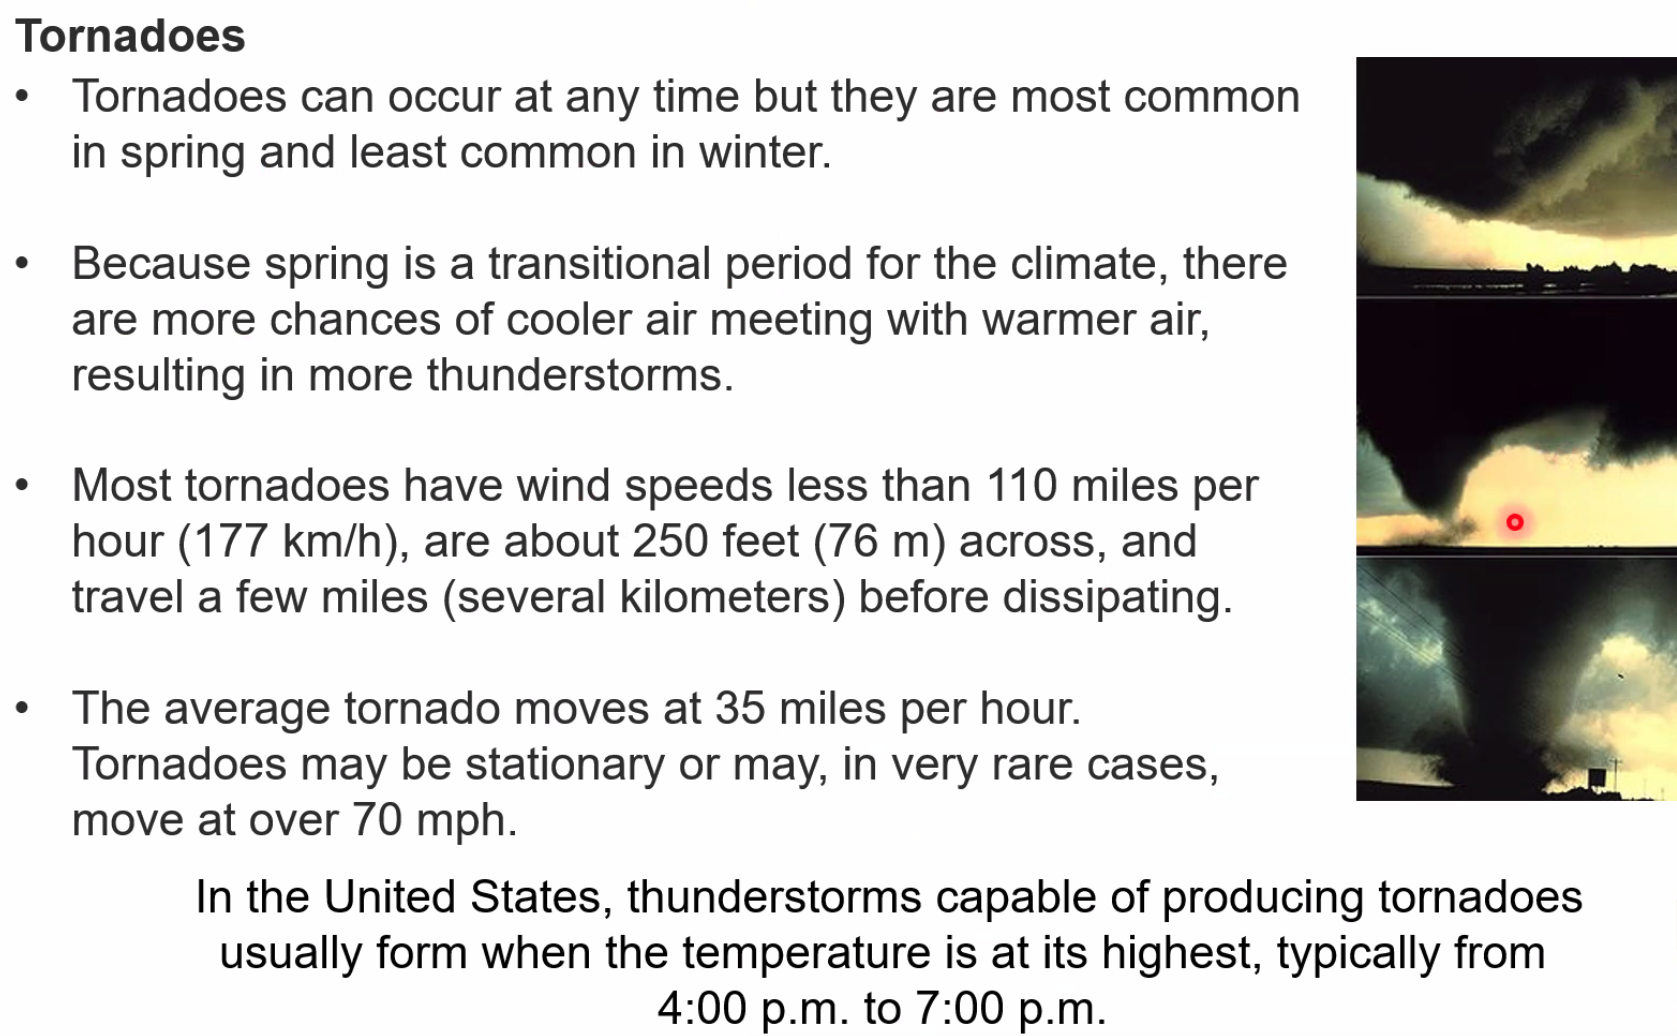
Tornadoes
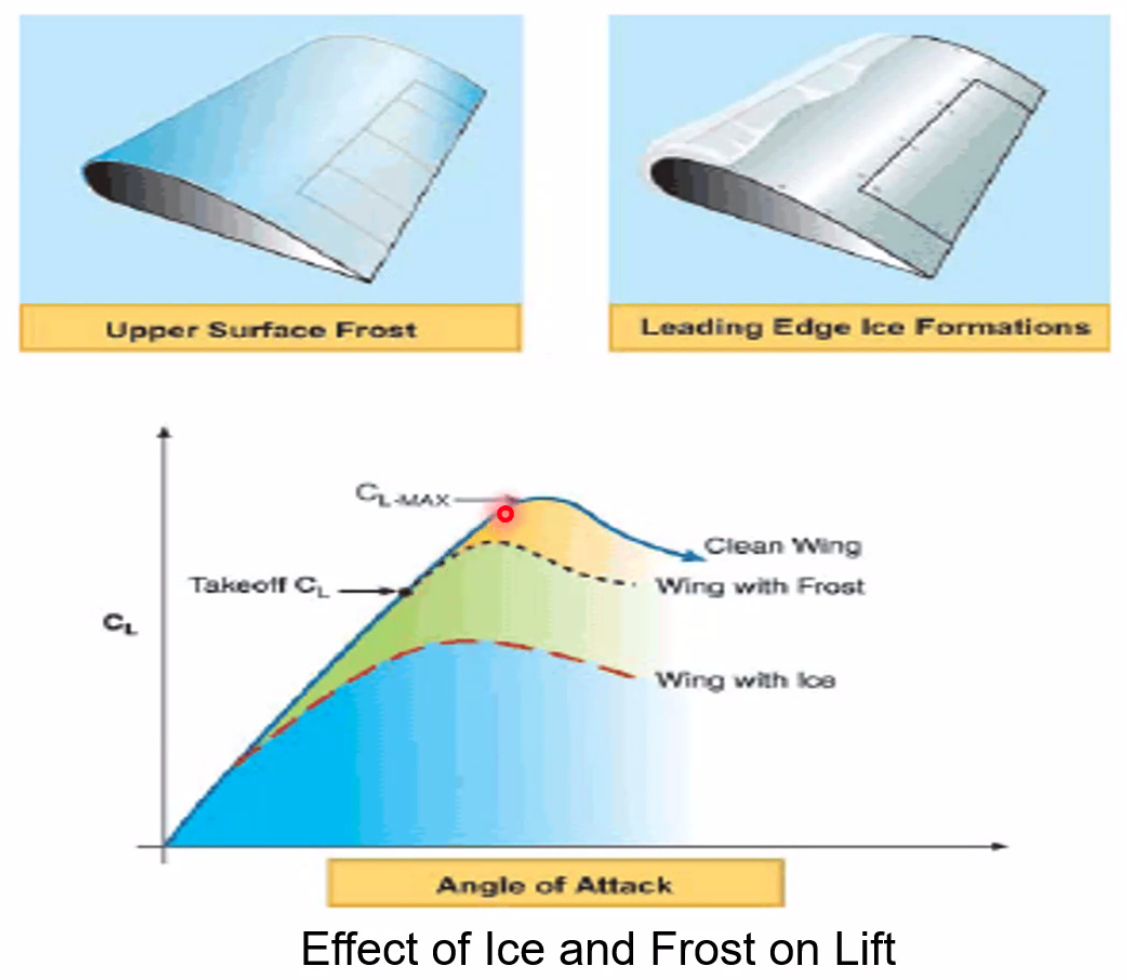
Icing
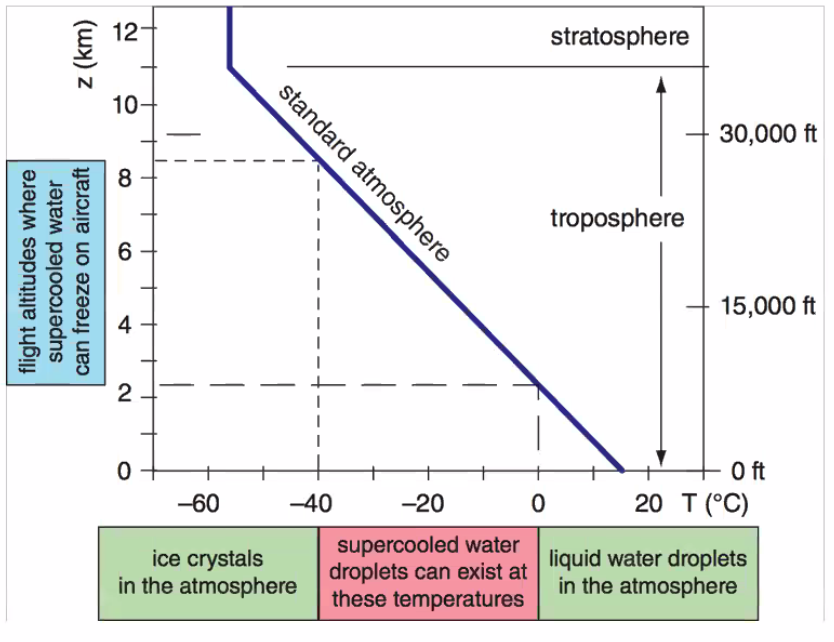
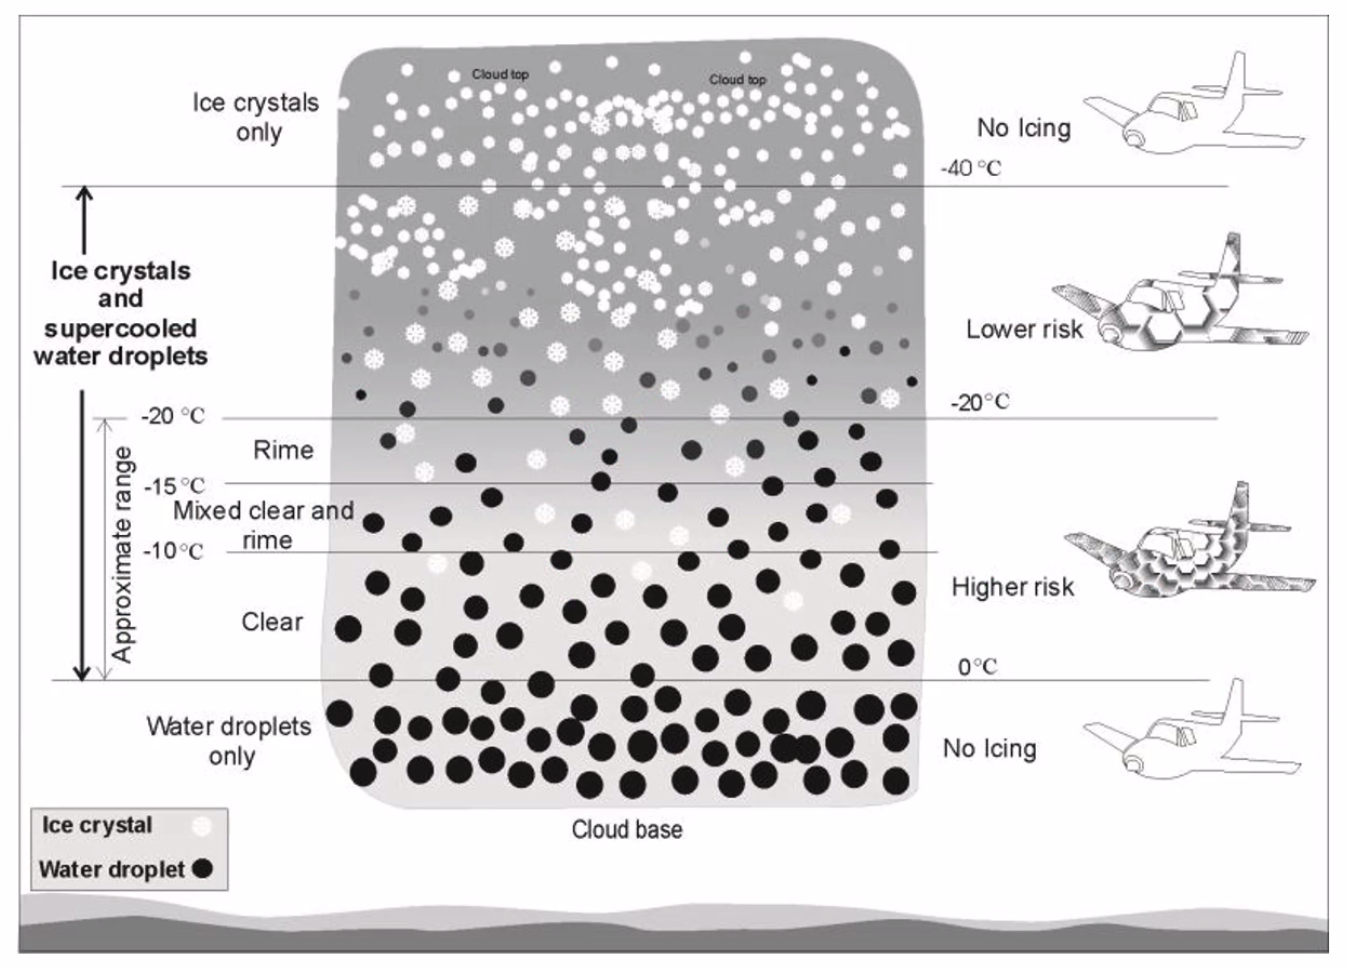
Supercooled water droplets
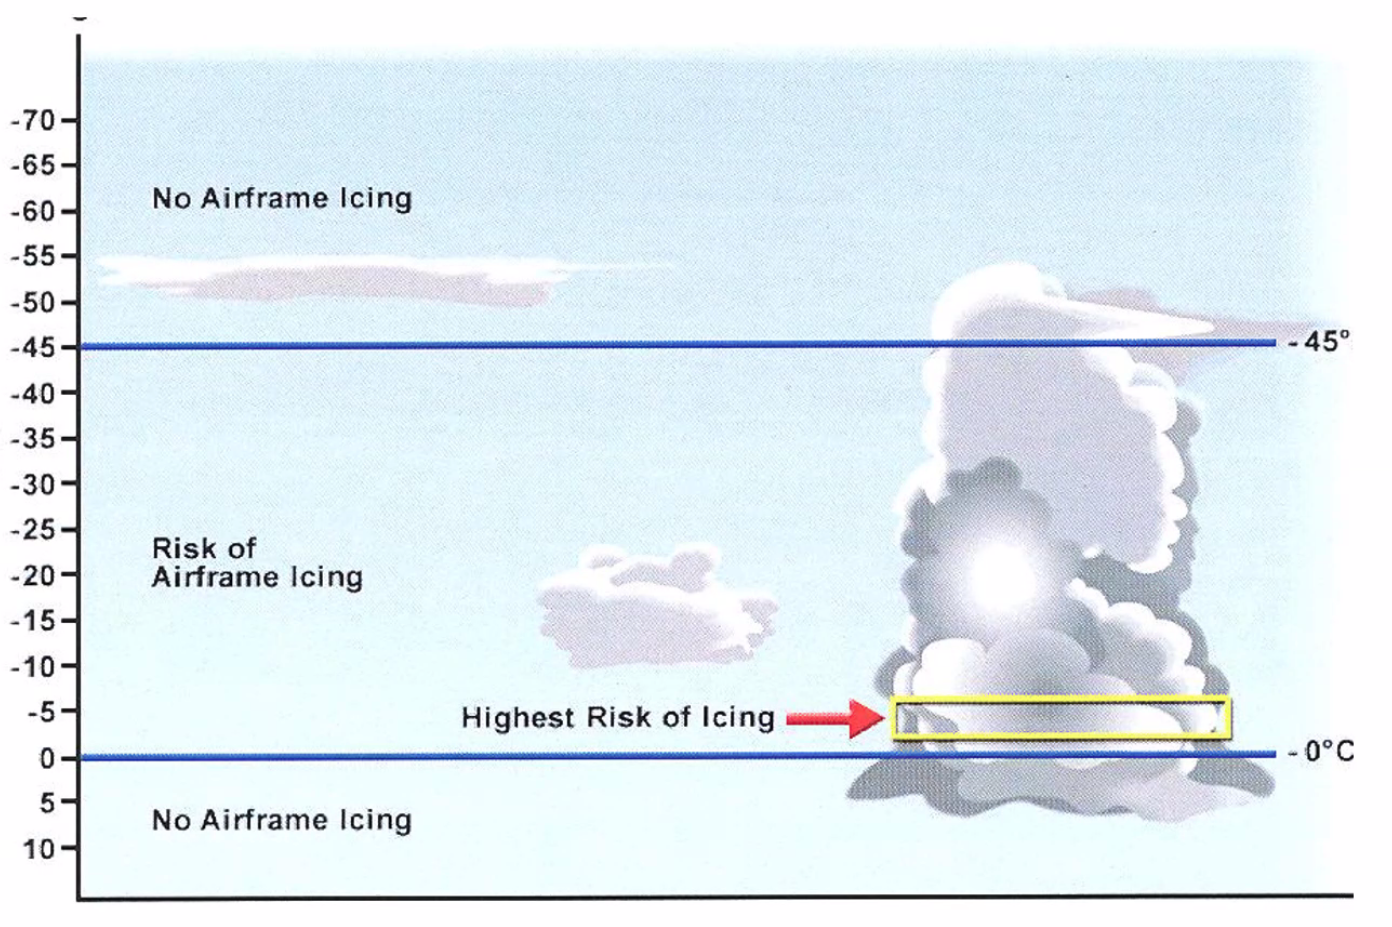
- Ice accretes most often as a result of the impact of supercooled water droplets of various sizes on the aircraft
- SCWD can exist in cloud from 0 to -40C
- SCWD are quite small relative to rain and drizzle
- Most icing encounters involve droplets with diameters between 10 and 50 microns
- Supercooled Large Droplets can have diameters up to 100times later
- Mass of these large droplets is so great that they can strike aft of the icing protected regions of the aircraft.
- Water droplets do not all freeze as soon as the ambient temperature fall below 0C because of the release of latent heat as water changes state to ice
- By -20C most of the supercooled water has turned to ice
Types of Icing
- Clear
- Rime
- Mixed
- Rain Ice
- Engine Icing
- Hoar Frost
- High altitude ice crystal icing
For every degree below 0, 1/80th of the water droplet will freeze on impact. The nearer to 0 you are the more will flow over the airframe and freeze.
Clear Ice
- Initial impact of supercooled droplets strike the surface, the remaining water flows over the AC surfaces and freezes gradually
- Can spread beyond the reach of de-icing equipment on the aircraft and can be difficult for the pilot to see.
Highest proportion of dangerous clear ice forms in cloud at temperatures just below 0C
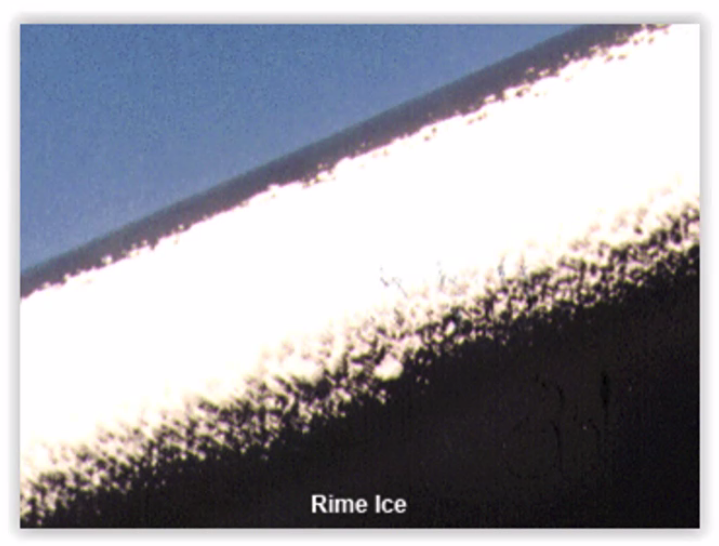
Rime Ice
- Formed from small supercooled droplets when the remaining liquefied portion after initial impact freezes rapidly before the drop has time to spread over the surface
- Most common type of icing
- lighter in weight than clear ice
- Its formation is irregular and its surface is rough
- Brittle and easy to remove
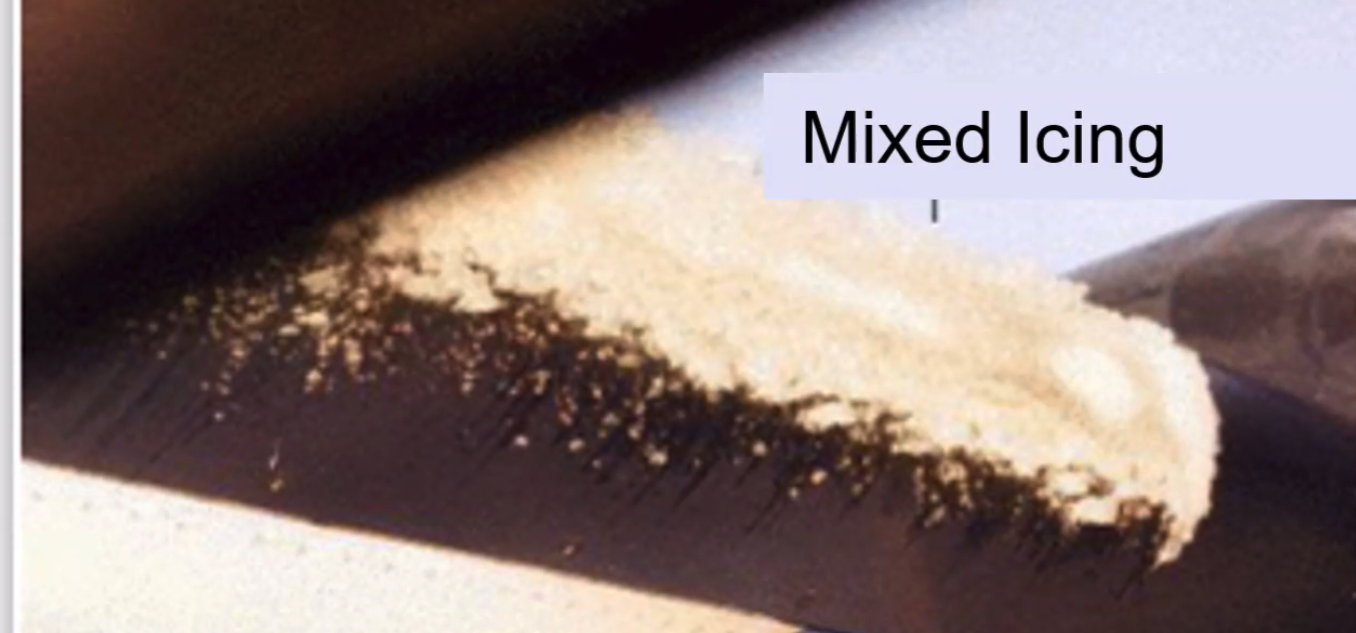
Mixed Ice
- Formed when supercooled water droplets are of various sizes or are intermingled with snow or ice particles
- Forms when both clear and rime ice occur at the same time
- After initial impact, the remaining portion freezes rapidly and forms a mushroom shape on the leading edges of a wing
- Ice particles are embedded in clear ice and form a hard and rough-edged mass
Icing is considered a cumulative hazard as it takes time for the ice to build up and increasing changes the aircraft flight characteristics.
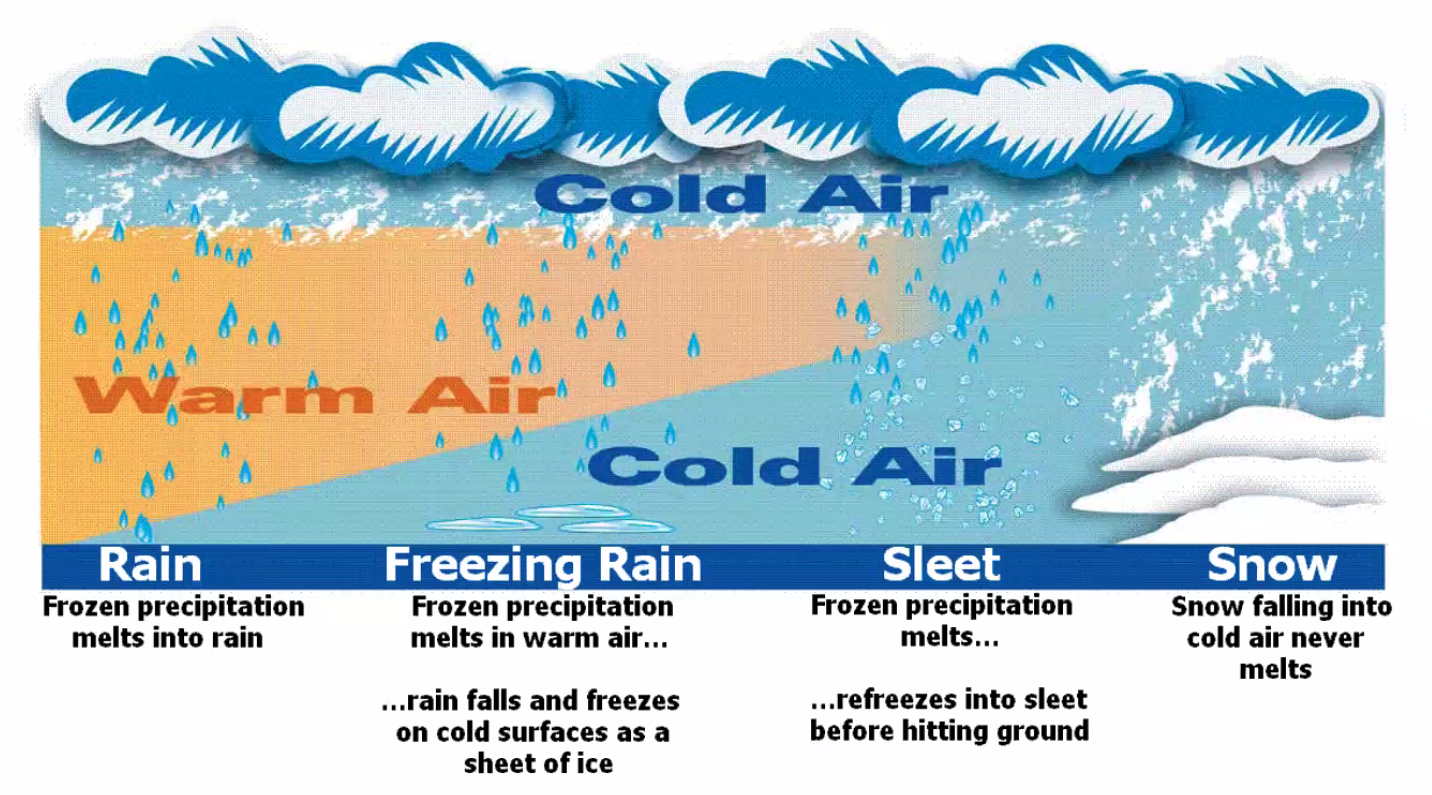
Freezing Rain
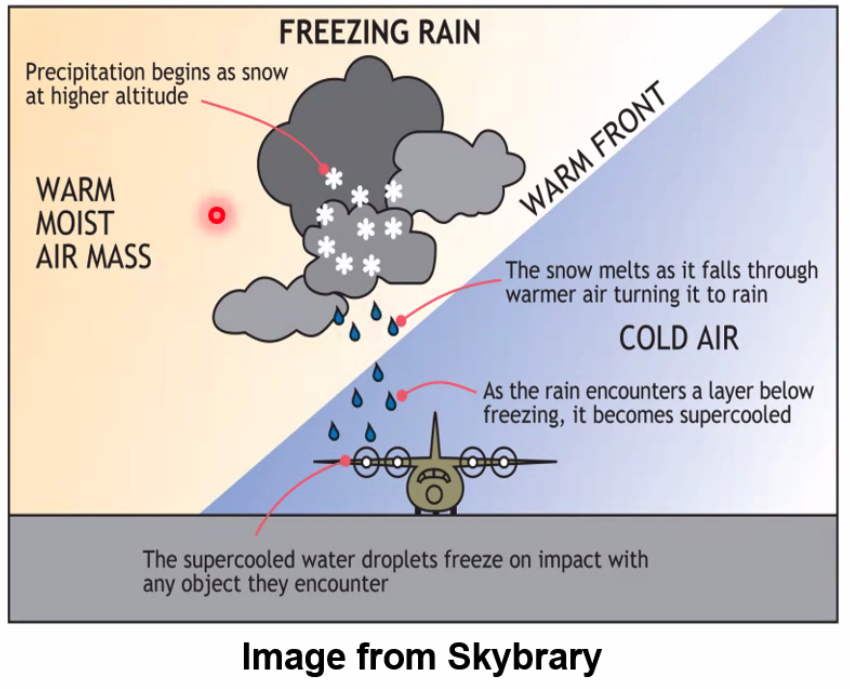
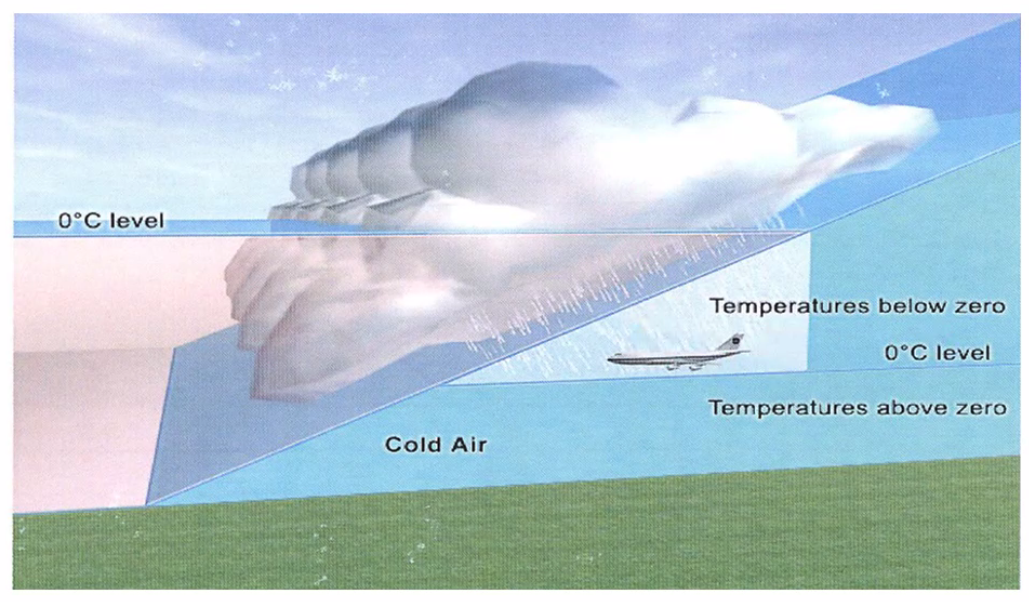
Best response is to avoid this Rain triangle. On the ground check information on runway braking action before taxiing for take-off or attempting a take-off or landing.
Hoar Frost
- A uniform thin white deposit of fine crystalline texture
- forms on exposed surfaces during calm, cloudless nights when temperature falls below freezing and the humidity of the air at the surface is close to the saturation point.
- Not associated with precipitation
Engine Icing - Carburettor
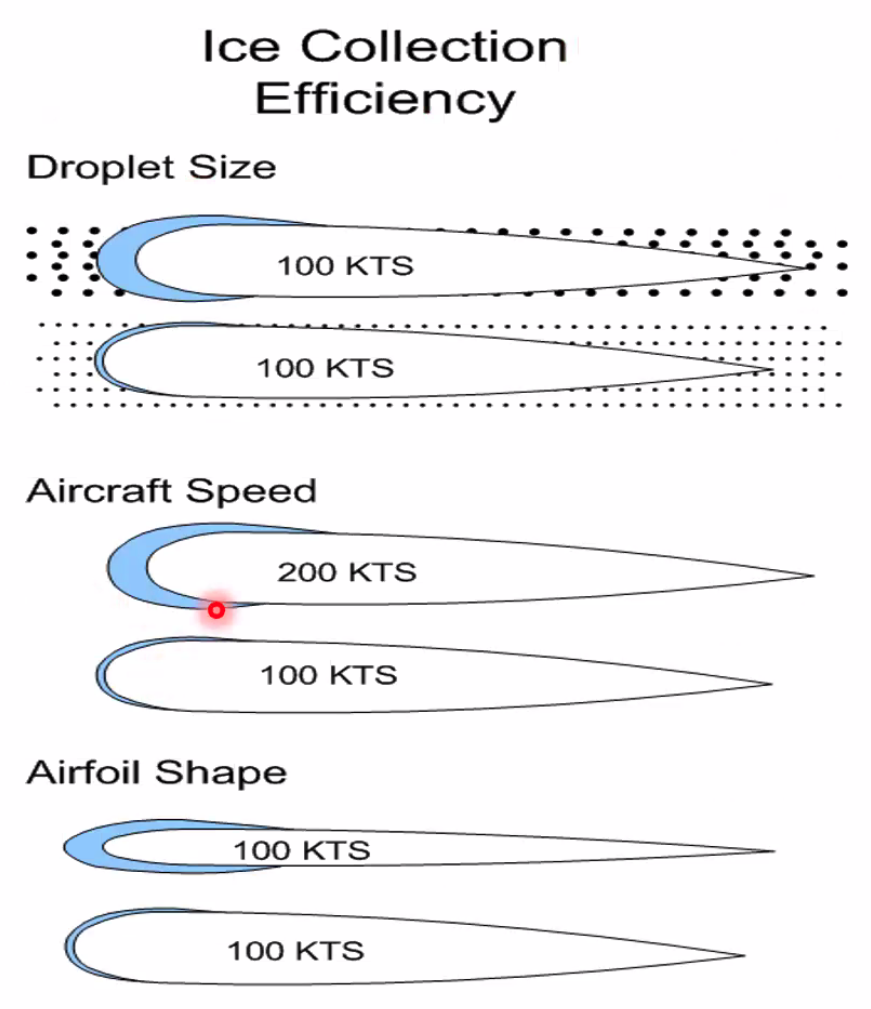
Wing shape and speed
- A thick wing sends out a bigger pressure waves ahead of the wing - causing the airflow to divide well ahead of the wing so a lot of the moisture will miss the wing
- A thin wing does not give as much warning to the air ahead of the wing, so alot of the supercooled drops collide with the wing
Influences on Ice Formation
Cold Soak effect - The wings of aircraft are said to be ‘cold-soaked’ when they contain very cold fuel as a result of having just landed after a flight at high altitude or from having been refuelled with very cold fuel. Clear icing may occur if precipitation falls, even in ambient temperatures -3 to +15C, ice or frost can form in the presence of visible moisture
Radiative cooling - a process by which temperature decreases due to an excess of emitted radiation over absorbed radiation. (Results in a net energy loss over night/ time)
Ice Crystal Icing - several engine power loss and damage events have occurred in convective weather above the altitudes typically associated with icing conditions
Thunderstorms and CBs can lift high concentrations of moisture to high altitudes where it can freeze into very small ice crystals, Radar reflectivity is only about 5% of average-sized raindrops. They do not appear on weather radar displays
These crystals can affect an engine when flying through convective weather.
Indications - initial accretion and aggregation of ice crystals on relatively warm surfaces (typically forward of an engine) and then breaking off and entering the engine/ engine core.
Cloud ice water content - cloud ice mass in unit volume of atmospheric air, can vary from 0.0001 g / m3 in thin cirrus to 1g/m3 inside a convective core. However it is suggested that it can reach up to 8g/m3 in areas of high ice crystal density.
Presence of Ice Crystals - Detecting it:
Avoidance
- monitor weather radar
- avoid by 20NM, some engines require avoidance by 50NM
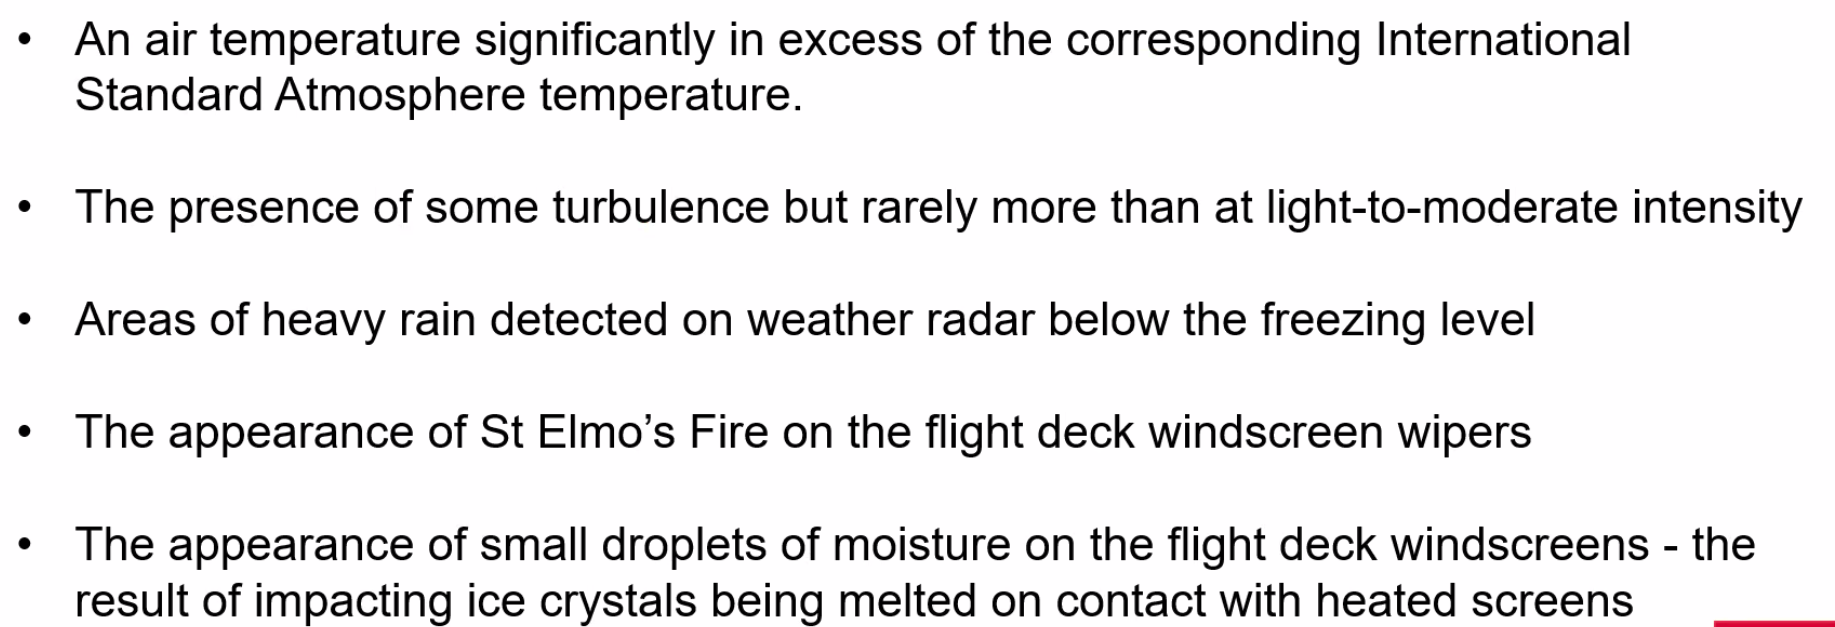
==Q. Where on the aircraft does ice crystal icing form?== A. Inside the jet engine
==Q. A jet aircraft flies downwind of a large CB cell and notices small water droplets on the windshield and unreliable indications of the OAT, despite flying in clear air well outside the cloud. Which type of icing is possible to occur?== A. Ice Crystal Icing
Documentation
 RVR - Not forecasted
LO: State that numerical weather prediction uses a 3d grid of weather data, consisting of horizontal data (lat-long) and vertical data (height or pressure)
Numerical Weather Prediction (NWP) data are the form of weather model data we are most familiar with on a day to day basis
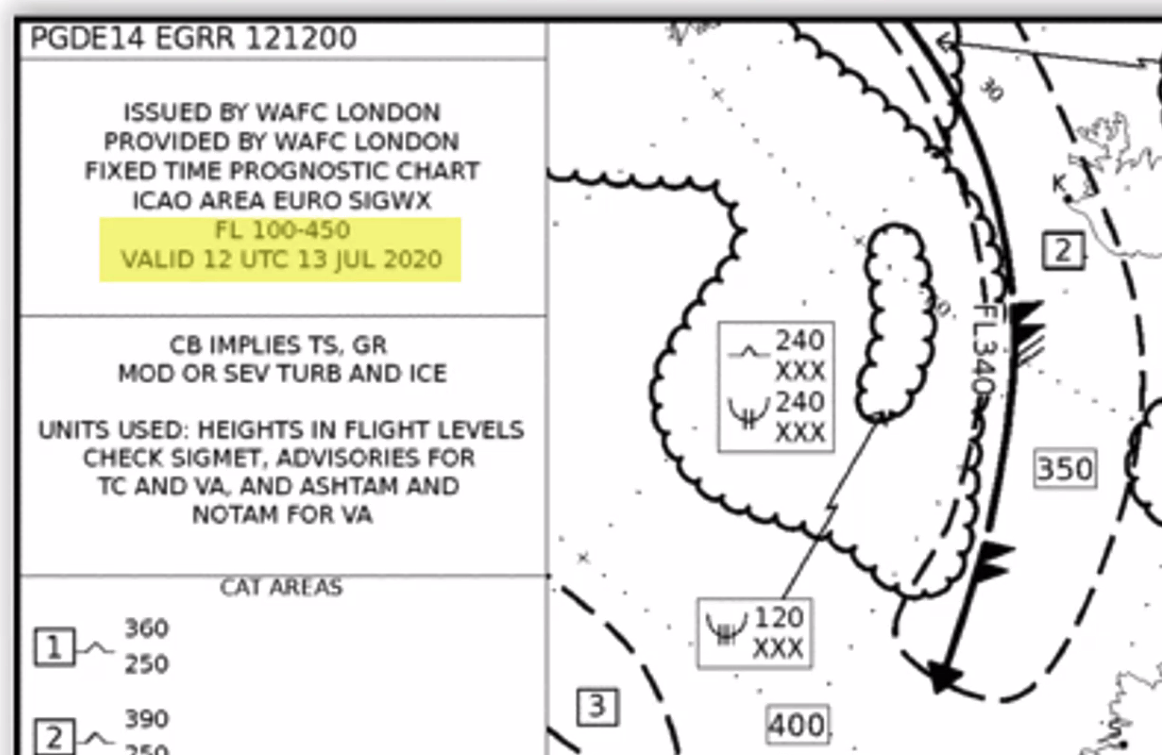
XXX implies that the lower part of that system originates from below what is recorded on the chart. Notice how in the highlighted area it has a lower limit of FL100.
Jetstream is shown when the wind is above 80kts. Not the 60kts which is the condition to be classed as a jetstream.
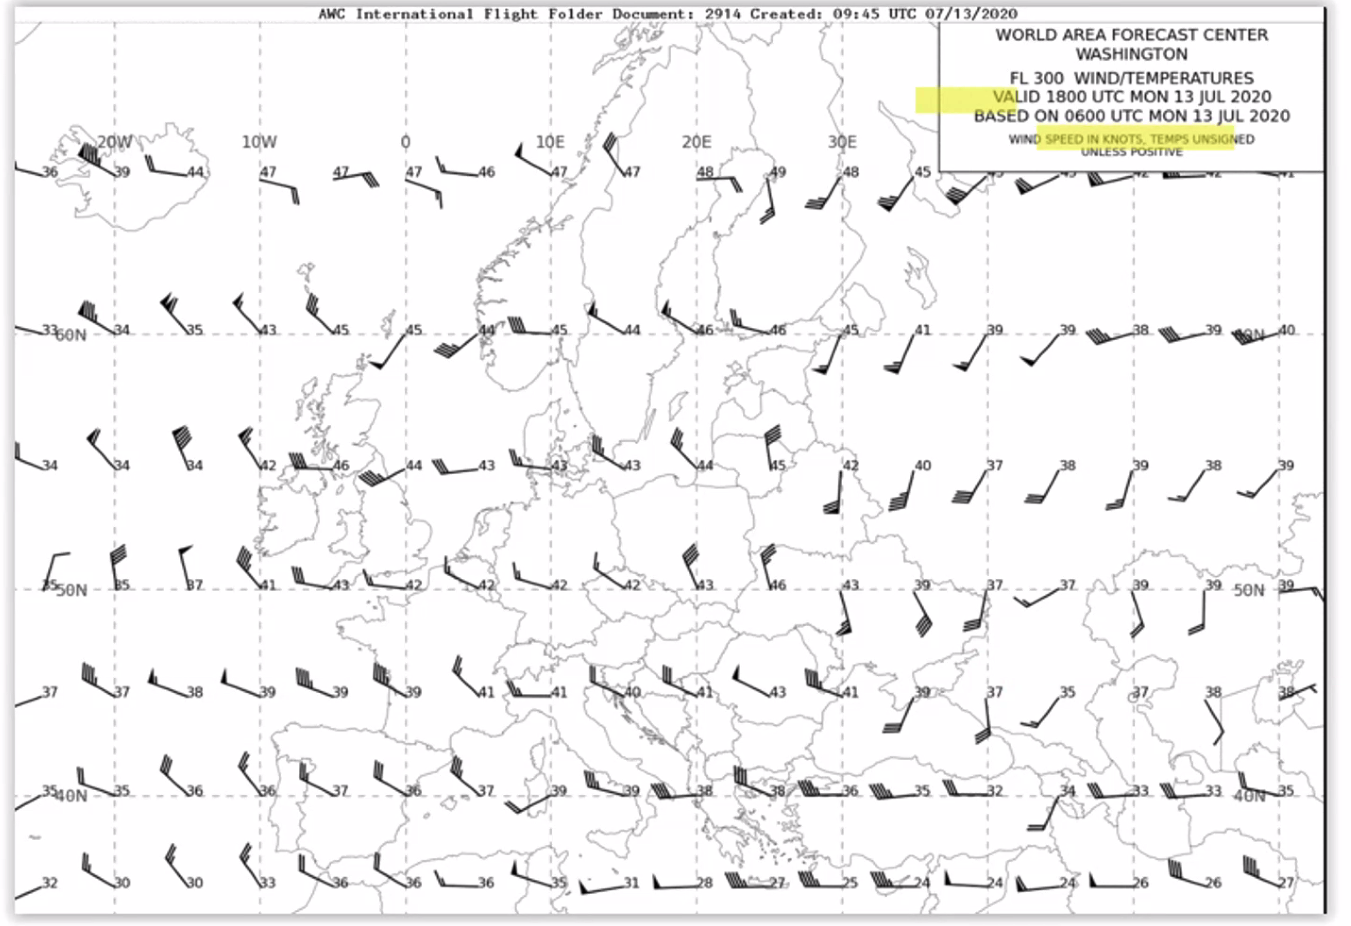
Important to note: All Temps are negative (unless otherwise states)
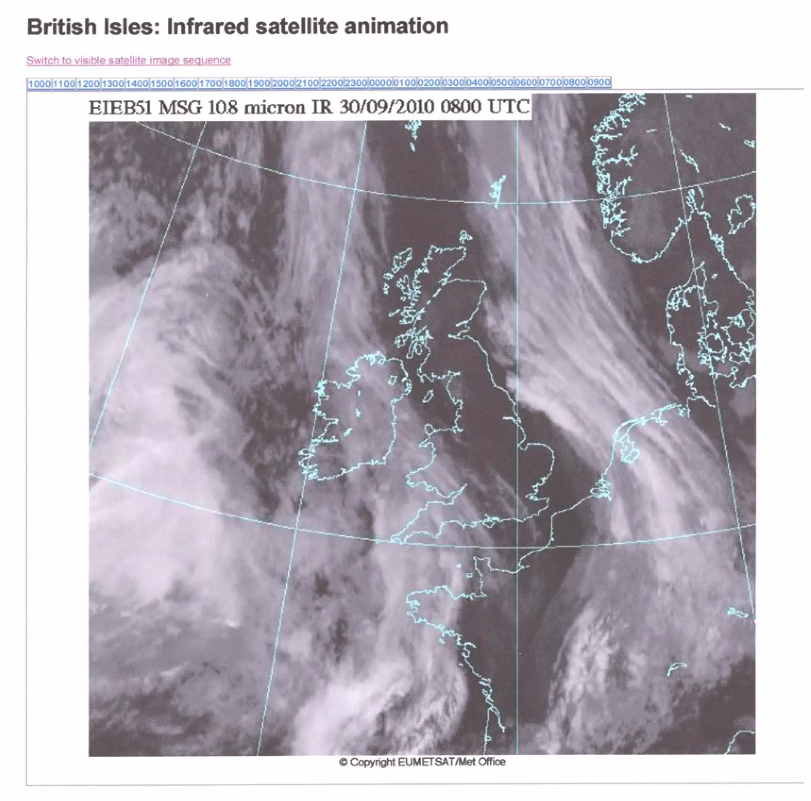
Weather satellites:
- geostationary - high altitude (36000 km) over the equator, big picture but not much detail
- Polar orbiting - lower altitude (900kms), lots of them, smaller picture but better detail
Imagery
- Visual - will show low cloud and fog, but higher level cloud will mask this
- Infrared - sees cold cloud as high level, wont see low cloud. Good for highlighting fronts.
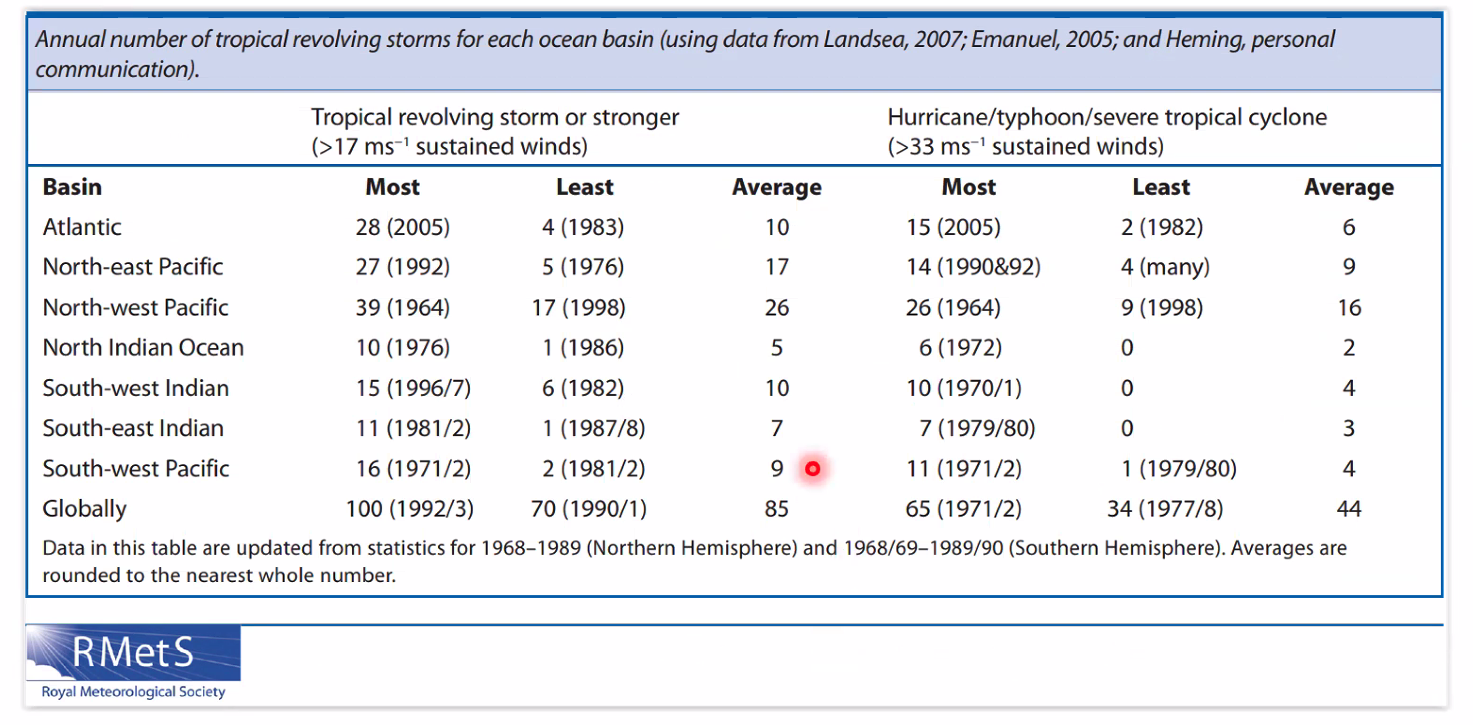
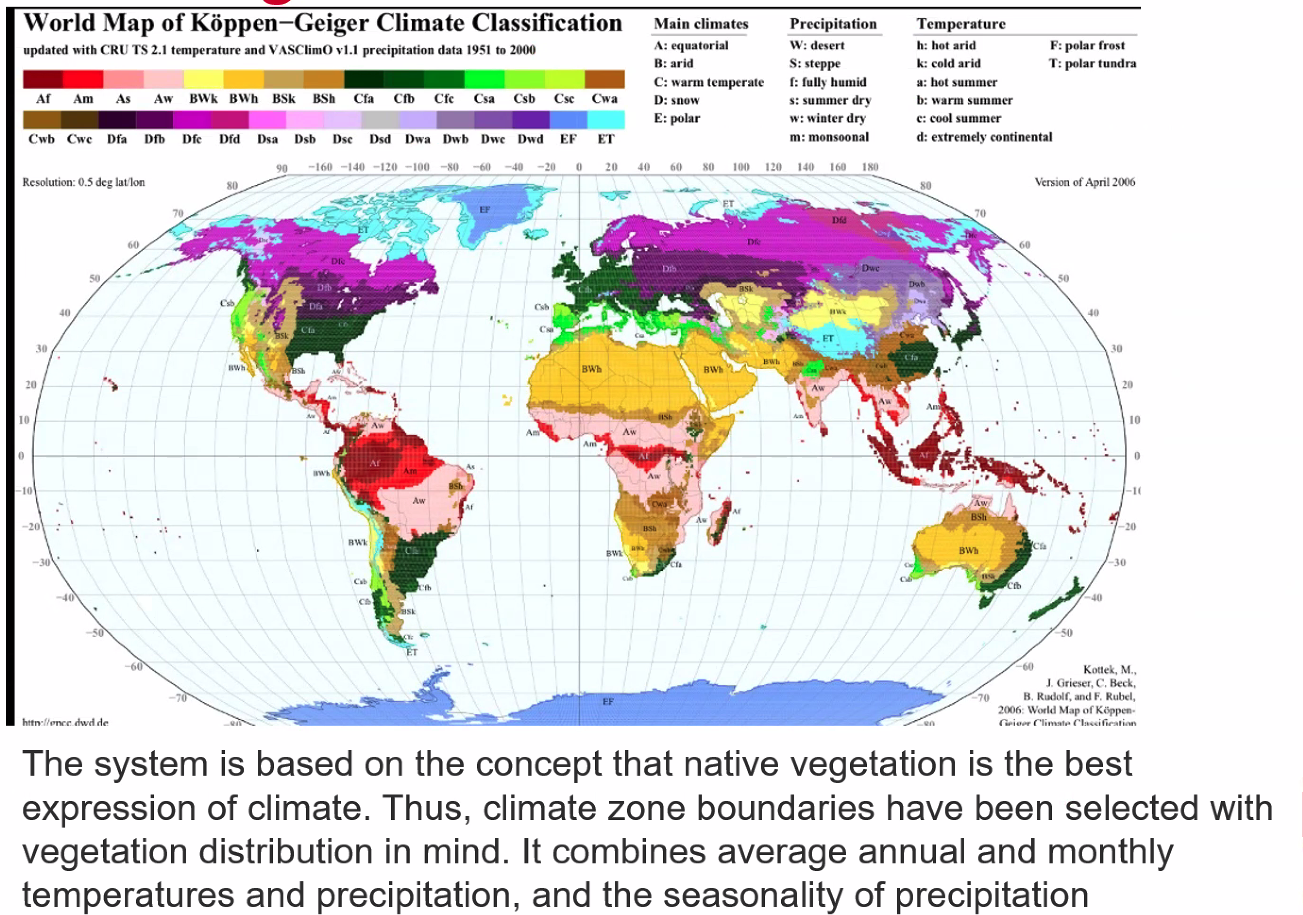
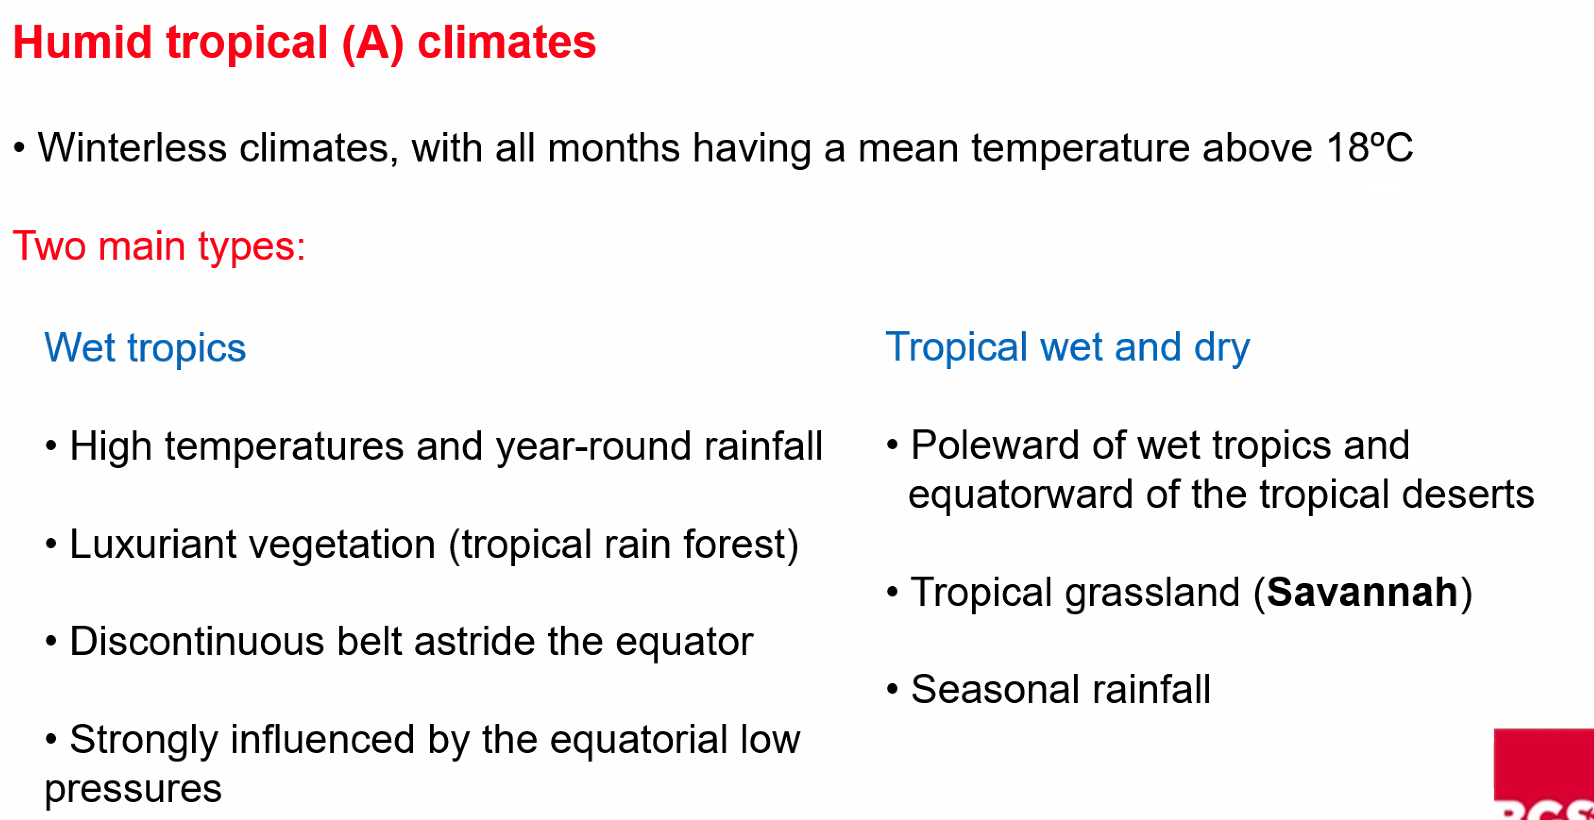
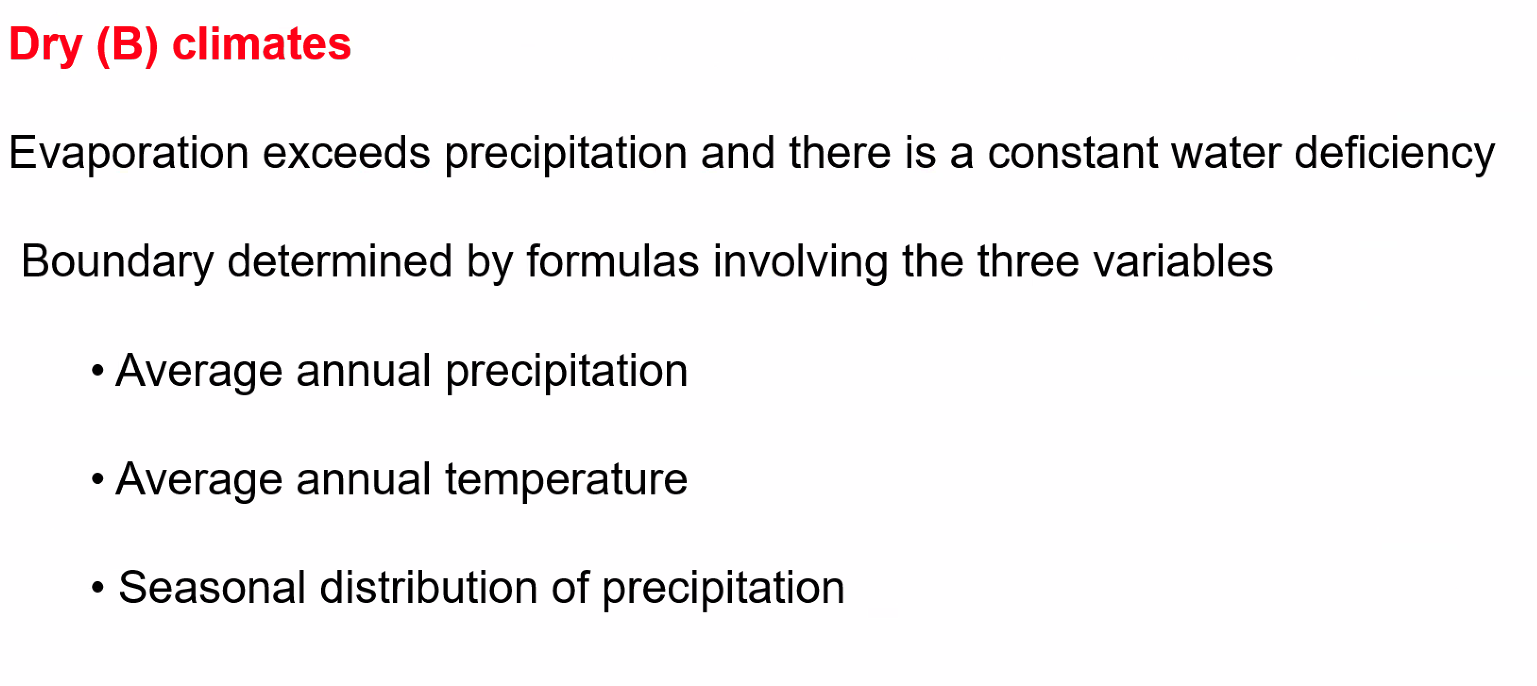
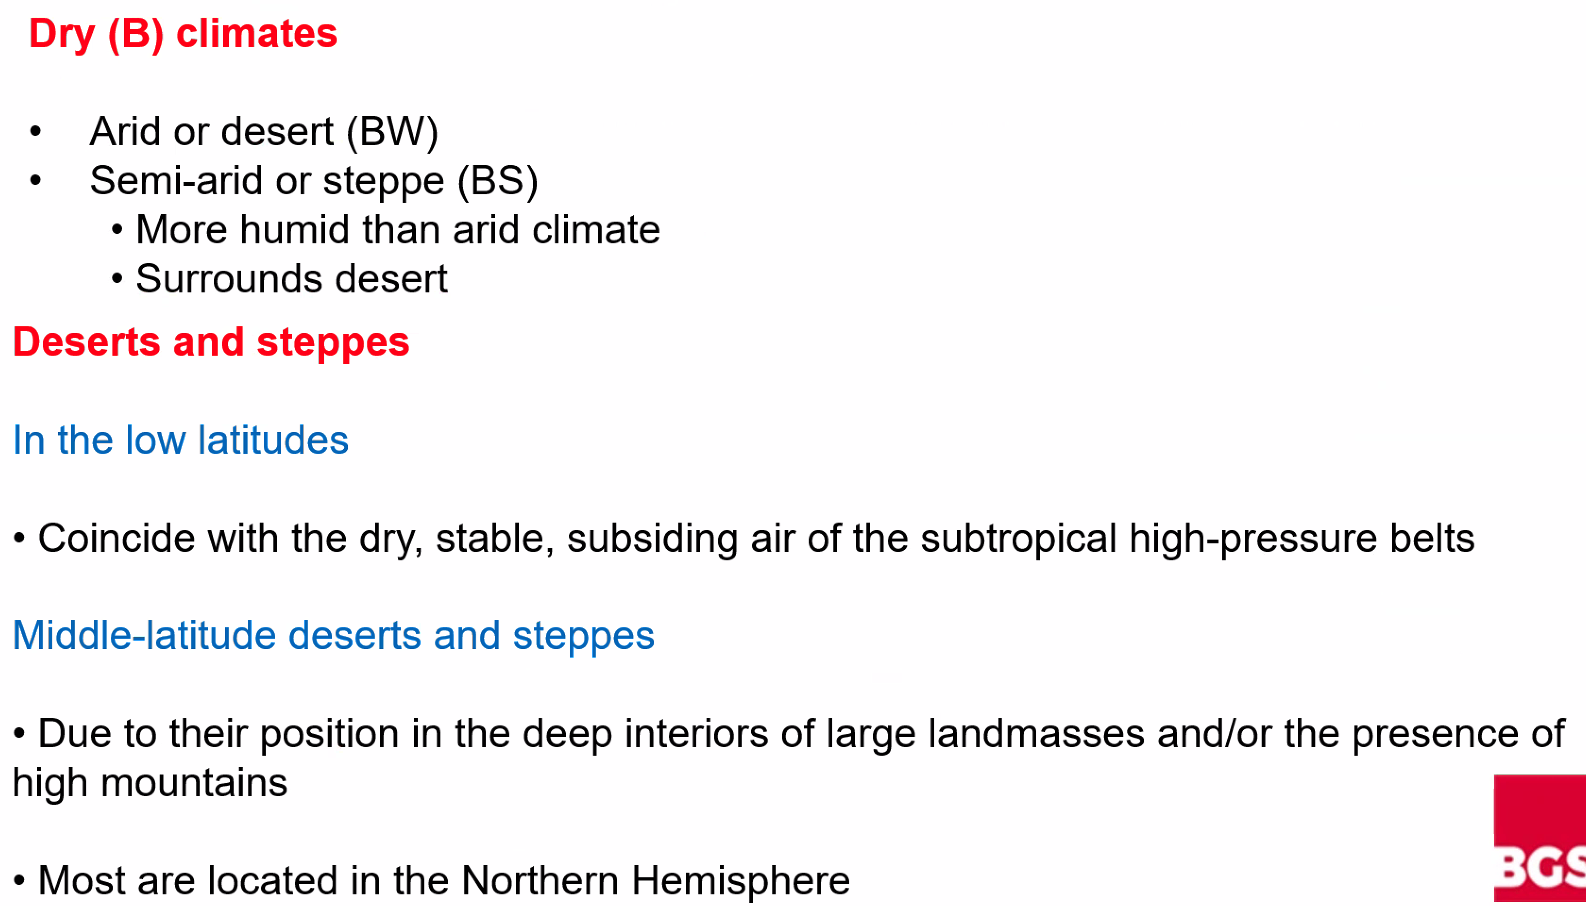
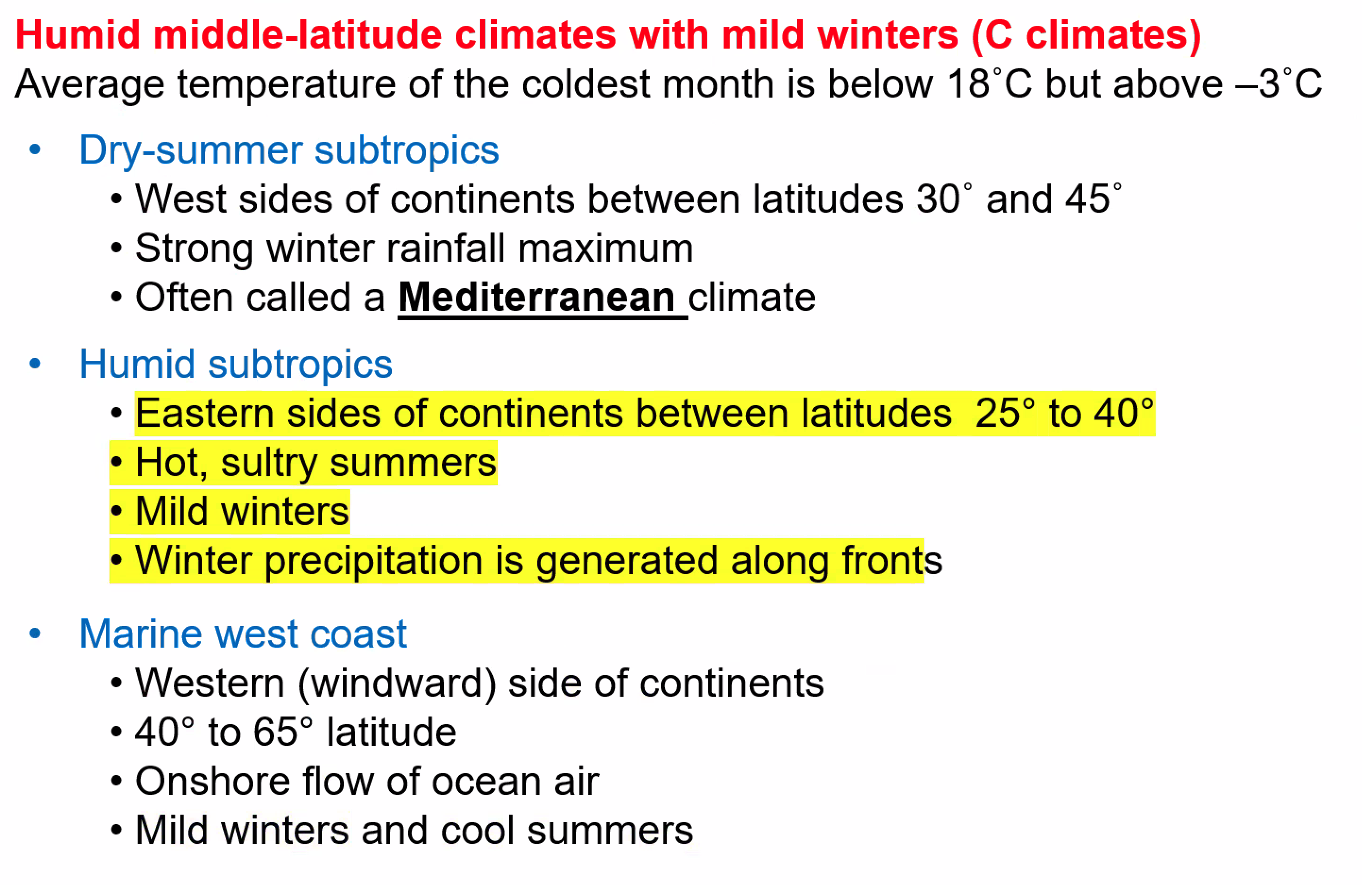
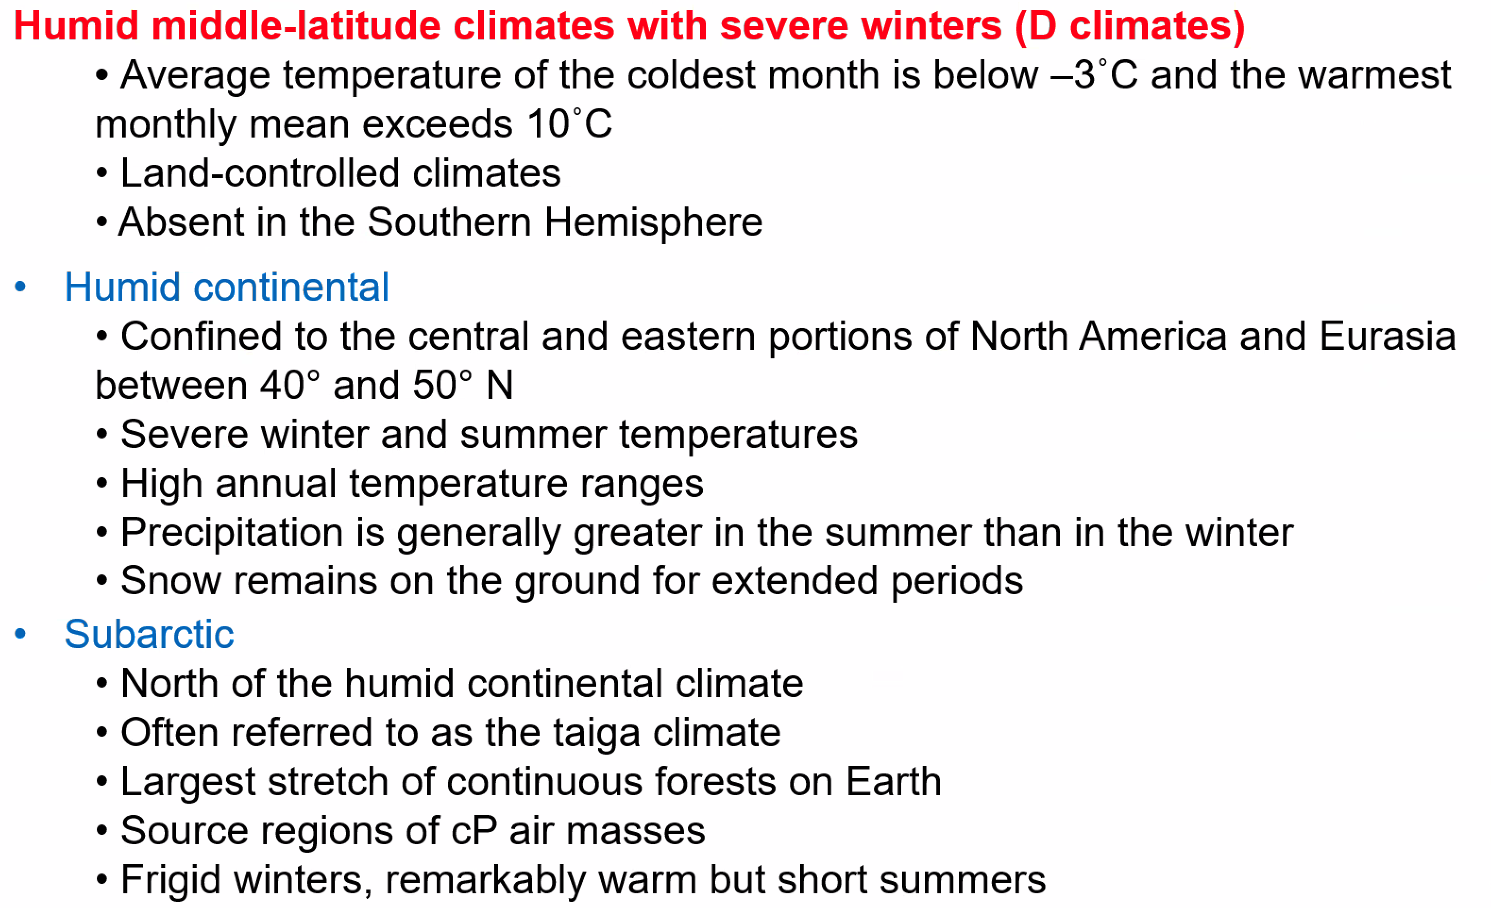
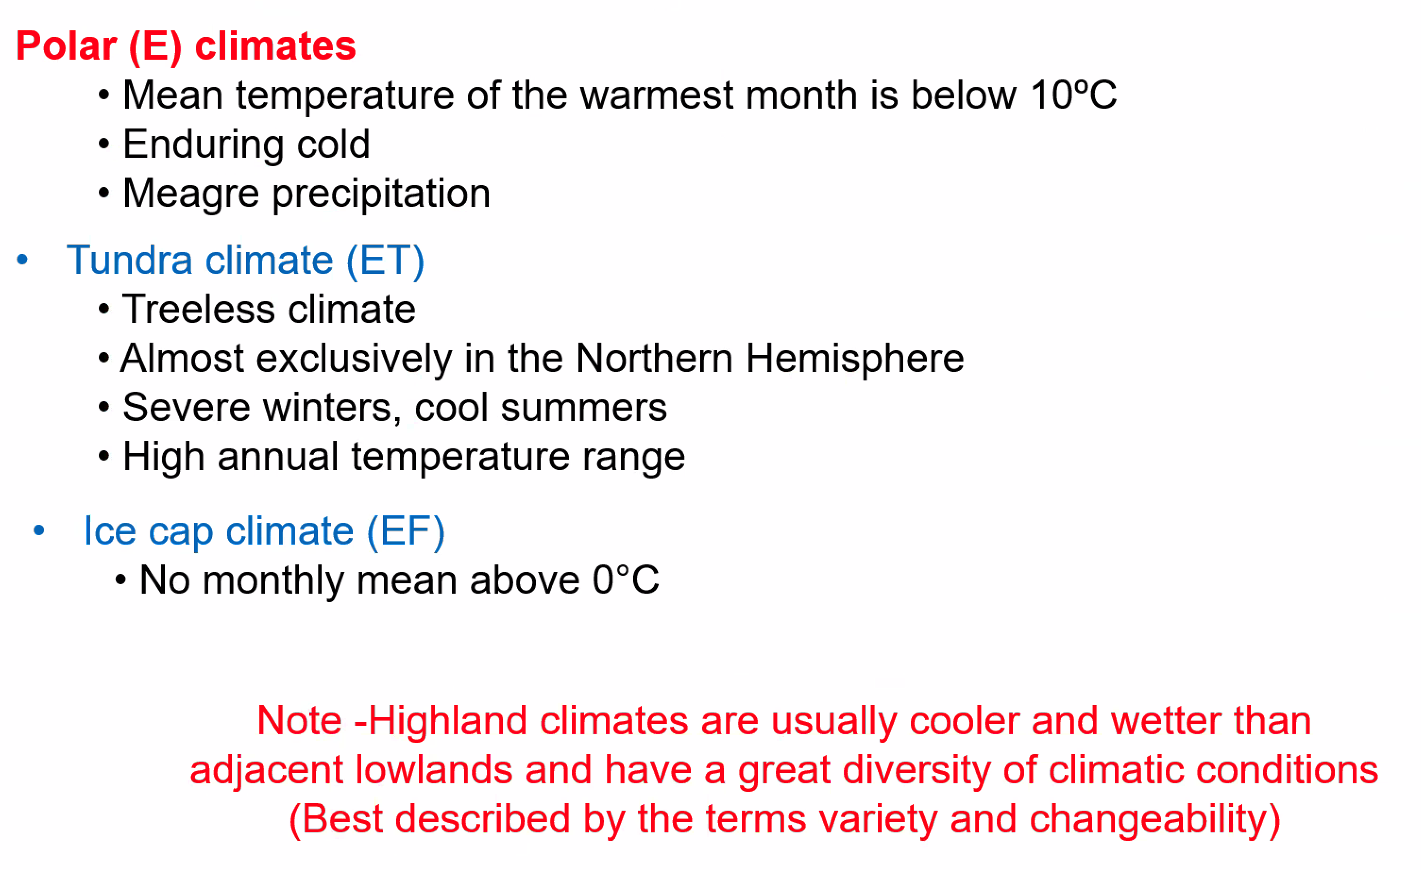
Climatology
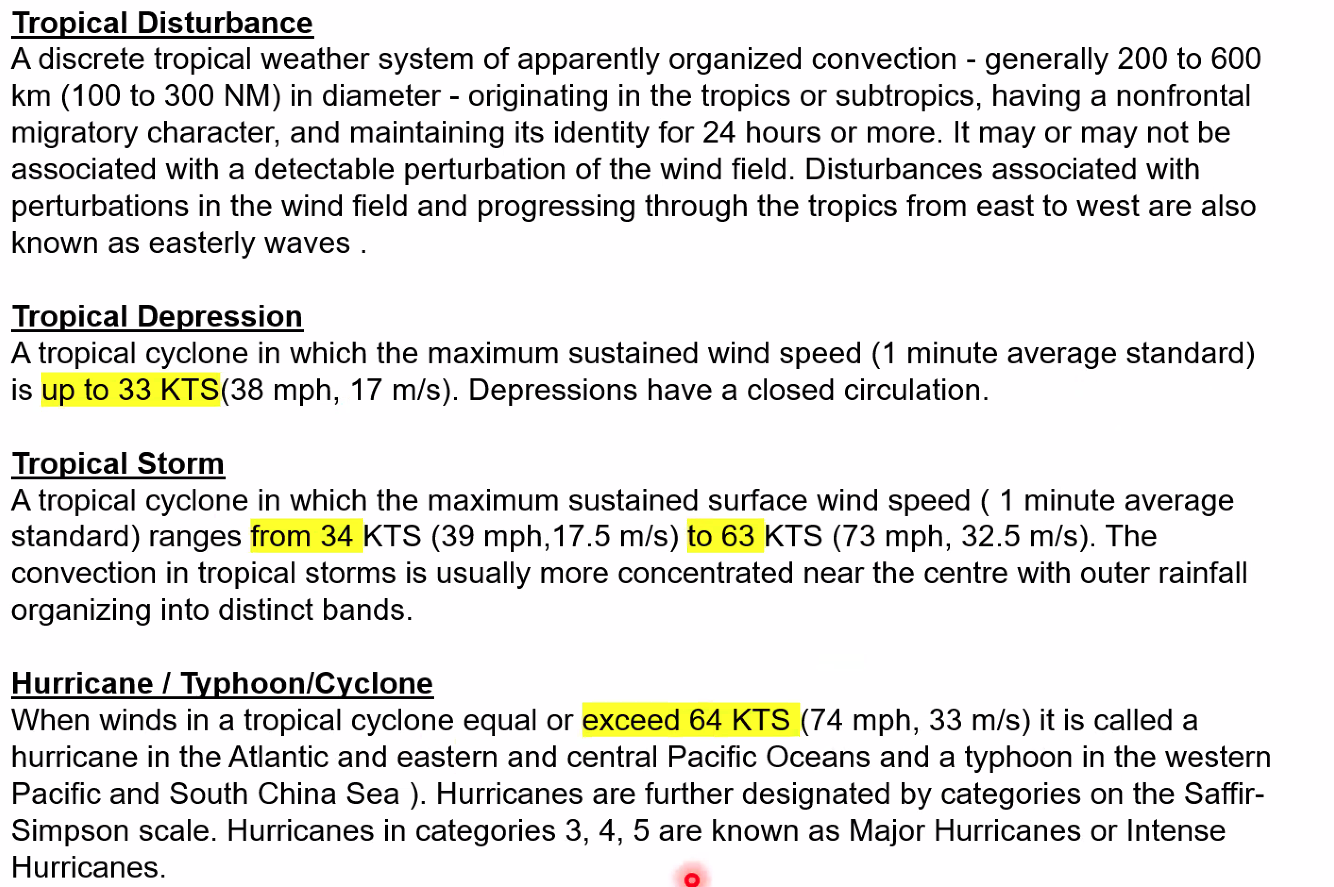
Above 63kts it is considered a hurricane and not a tropical storm.